Iovance Biotherapeutics, Inc.
$13.62 −11.0% from 52-week high · +673.9% from 52-week low
This analysis is based on closing-price data as of October 16, 2026. Whether you're researching how to buy Iovance Biotherapeutics, Inc. stock or you've just opened a brokerage account and are trying to time an entry, here are objective support levels and stop-loss references built from the RSI, MACD and ATR indicators.
Snapshot as of Oct 16, 2026 close
| Item | Value | Note |
|---|---|---|
| Close | $13.62 | −7.47% on the day; Sep 30's $14.82 remains the highest close in the window |
| 52-week high / low | $15.30 / $1.76 | −11.0% / +673.9%; the high is the Sep 29 intraday print |
| SMA 5 / 20 / 60 | $14.32 / $13.05 / $9.22 | SMA5 > SMA20 > SMA60 intact (since Aug 7); close now below SMA5, above SMA20 |
| Bollinger (20) | $16.49 / $13.05 / $9.62 | Width 52.67% — still wide; close just above the mid-band |
| aVWAP 90d (anchor Sep 29, 2026) | $14.10 | Close below — average buyer since the gap day is under water |
| aVWAP 2y (anchor May 9, 2025) | $4.13 | Long-term anchor near the cycle low; price far above |
| RSI (14) | 59.88 | Back below 70; bearish RSI divergence flagged |
| Mansfield RS vs Nasdaq Composite | +180.15 | Outperform; −21.21 vs a week ago (slowing), +31.24 vs a month ago |
| MACD (12,26,9) | 1.300 / 1.410 / −0.110 | Dead cross Oct 14, well above zero |
| ADX (14) | 54.62 (90d) / 54.29 (2y) | Strong trend, easing from early-October levels |
| ATR (14) | $0.87 (6.40% of price) | High volatility |
| OBV 2y / 90d | Early distribution / Early distribution | Both below MA20, flat (MA20 gap −7.28% / −2.37%); no OBV divergence flagged |
| Volume vs 20d avg | 0.696x | 12,168,100 vs 17,479,515 avg; scan-universe median ~0.87x that day |
| 1× / 2× ATR stop | $12.75 / $11.88 | 2× ATR reference = −12.8% from close, inside the Sep 29 gap |
① Price & Moving Averages
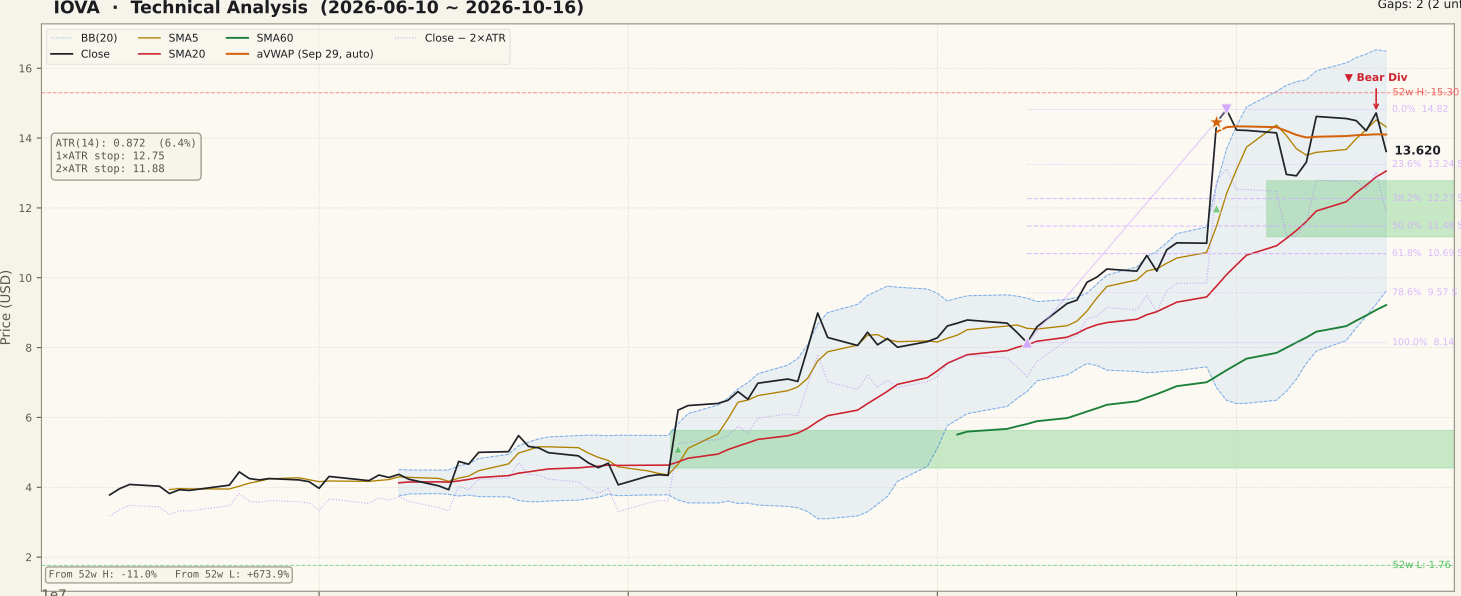
The moving-average stack SMA5 ($14.32) > SMA20 ($13.05) > SMA60 ($9.22) has held since August 7 and all three averages are still rising, but Friday's close at $13.62 slipped under SMA5, so the full Close > SMA5 > SMA20 > SMA60 order is broken at its top step. The 90-day chart is a staircase — the August 6 gap, a September climb from the $8.14 swing low (Sep 10), and the September 29 gap (about +31.5% on a company guidance update) that set the $15.30 high and a $14.82 close on September 30. Since then price has moved sideways below that September 30 close. Friday's close sits below the 23.6% retracement of that swing ($13.24) and about 4% above the rising SMA20; the 38.2% level ($12.27) lies inside the unfilled September 29 gap ($11.17–$12.78). The short-term anchored VWAP from the gap day ($14.10) is now overhead.
② Volume

The advance is defined by two volume spikes — the August 6 and September 29 gap days — and neither falls in the latest five sessions. This week was quiet: every session traded below its 20-day average, and Friday's −7.47% decline printed 12,168,100 shares, 0.696x the average of 17,479,515. The whole market was light (the median stock in our scan universe traded around 0.87x its own average that day), so the drop does not look like heavy liquidation. Equally, the October 9 and October 15 up days were not accompanied by expanding volume. Volume has simply contracted since the gap, which fits a digestion phase more than a fresh push.
③ MACD

MACD (1.300) crossed below its signal line (1.410) on October 14, ending the run that began with the September 16 golden cross; the histogram is now −0.110 and widened on Friday. The cross happened far above zero, so it reads as momentum cooling inside an uptrend rather than a trend reversal — the MACD line itself is still strongly positive. A dead cross this high often resolves into a sideways pause; the histogram turning back toward zero would be the first sign the pause is ending, while a MACD line falling toward the zero axis would mean the trend itself is weakening.
④ RSI

RSI(14) dropped to 59.88 on Friday, out of the overbought zone it had occupied for most of the past two weeks. The chart tool flags a bearish RSI divergence: its first reference peak is August 20 (price $8.99, RSI 83.51), and the second price reference is the October 15 close of $14.72 — a much higher price with lower momentum readings in October. (The RSI figure attached to that second peak in the data does not match the same-day RSI reading, so it is not quoted here.) A divergence is a caution flag, not a top call; it gained some weight this week because price did follow through lower. RSI holding the 50 area on further weakness would keep the trend's momentum profile intact.
⑤ Mansfield Relative Strength

Relative strength is why IOVA was selected: Mansfield RS vs the Nasdaq Composite is +180.15, deep in outperform territory. Week over week it fell 21.21 points (from +201.35) — still positive, but slowing — while month over month it is up 31.24 points (from +148.91), still accelerating on the longer view. The RS line was above zero and climbing through August and September before the gap; the past two weeks have given back part of the gap-day step. A third consecutive weekly decline would be a clearer sign that leadership against the Nasdaq Composite is fading.
⑥ ATR · ADX

ADX at 54.62 still marks a strong trend, though it has been edging down since early October as price moved sideways. ATR is $0.87, or 6.40% of price — near the top of its 90-day range after the gap and the wide October sessions. The 1× ATR reference is $12.75 and the 2× ATR reference is $11.88, about 12.8% below the close and inside the September 29 gap. With daily ranges this wide, position size matters more than the exact level.
⑦ OBV

OBV has shifted to early distribution on both timeframes: below its MA20 with a flat slope on the 2-year view (MA20 gap −7.28%) and on the 90-day view (−2.37%). On the 90-day chart OBV peaked with the September 29–30 surge, drifted lower through October and has now dipped just under its rising MA20 after Friday's decline. No OBV divergence is flagged. This is a mild warning rather than a heavy one — the volume behind recent down days was light — but it means volume flow is no longer confirming the trend the way it did through September.
Bull vs Bear
Bull Case
- SMA5 > SMA20 > SMA60 since Aug 7, all three rising.
- Mansfield RS +180.15 vs the Nasdaq Composite, up 31.24 points over a month.
- Close still above the rising SMA20 ($13.05) and the Bollinger mid-band.
- The Sep 29 gap ($11.17–$12.78) is unfilled support below.
- ADX 54.62 — an established, strong trend.
- Friday's −7.47% came on 0.696x volume in a quiet market — no sign of heavy selling.
Bear Case
- MACD dead cross on Oct 14; histogram −0.110 and widening.
- Close below SMA5, the 23.6% retracement ($13.24) and the 90d aVWAP ($14.10).
- OBV in early distribution on both 2y and 90d views.
- Bearish RSI divergence flagged; RSI fell from overbought to 59.88.
- RS down 21.21 points week over week.
- ATR 6.40% of price; the 2× ATR reference sits 12.8% below the close.
Scenarios
| Scenario | Probability | Path | Trigger / Invalidation |
|---|---|---|---|
| Base-building above SMA20 | 40% | Price holds around the rising SMA20 ($13.05) and works sideways below $14.82 while MACD and RSI reset. | Trigger: closes holding above $13.05 and the MACD histogram turning back toward zero. Invalidation: a close below $12.78 (gap top). |
| Gap-fill pullback | 35% | Momentum keeps fading and price works into the Sep 29 gap, toward the 38.2% retracement ($12.27) and possibly the 2× ATR reference. | Trigger: a close below $12.78. Invalidation of the gap-leg structure: a close below $11.17 (gap bottom). |
| Resumption | 25% | Price recovers the 90d aVWAP and retests the $14.82 close high and the $15.30 52-week high. | Trigger: a close above $14.82 on above-average volume with MACD re-crossing its signal. Invalidation: rejection back below $13.24. |
Key Levels
| Price | Role | Basis |
|---|---|---|
| $14.82 | Resistance | Sep 30 close / Fibonacci 0% of the swing ($15.30 52-week high above) |
| $14.10 | Resistance | aVWAP 90d (anchored Sep 29) |
| $13.62 | Current | Oct 16 close |
| $13.24 | Pivot (support lost) | Fibonacci 23.6% retracement — swing support level, closed below on Oct 16 |
| $13.05 | Support | SMA20 / Bollinger mid-band |
| $12.78 | Support | Top of the unfilled Sep 29 gap ($11.17–$12.78) |
| $11.88 | Stop (2× ATR) | 2× ATR reference; inside the Sep 29 gap |
What to Watch
- Whether closes hold above the rising SMA20 ($13.05) and the Sep 29 gap top ($12.78).
- The MACD histogram — narrowing back toward zero would suggest the Oct 14 dead cross is a pause, not a turn.
- OBV recovering above its MA20 on the 90-day view versus extending lower.
- Mansfield RS week over week — a third consecutive drop would mean the leadership is cooling against the Nasdaq Composite.
- A close back above the 90d aVWAP ($14.10) on rising volume.
Conclusion
Past Analyses of This Stock same ticker · newest first
Other signals from this issue same publication date · 6 stocks
This analysis is an educational interpretation of chart data and is not investment advice. Probabilities and levels are subjective estimates; every investment decision, and its outcome, is your own responsibility. Where a stock has moved on a fundamental catalyst, technical signals alone are not a sufficient basis for a purchase decision.
Two Week Swing · twoweekswing.com · 4,600+ stocks screened weekly