Iovance Biotherapeutics, Inc.
$14.62 −4.4% from 52-week high · +730.7% from 52-week low
This analysis is based on closing-price data as of October 9, 2026. Whether you're researching how to buy Iovance Biotherapeutics, Inc. stock or you've just opened a brokerage account and are trying to time an entry, here are objective support levels and stop-loss references built from the RSI, MACD and ATR indicators.
Snapshot as of Oct 9, 2026 close
| Item | Value | Note |
|---|---|---|
| Close | $14.62 | Sep 30 close $14.82 remains the highest close of the 2-year window |
| 52-week high / low | $15.30 / $1.76 | −4.4% / +730.7%; the high is the Sep 29 intraday print |
| SMA 5 / 20 / 60 | $13.59 / $11.91 / $8.46 | Close > SMA5 > SMA20 > SMA60 (stack in place since Aug 7) |
| Bollinger (20) | $15.93 / $11.91 / $7.90 | Width 67.39% — very wide; close in the upper half of the band |
| aVWAP 90d (anchor Aug 6, 2026) | $9.71 | Short-term anchor at the August gap; price well above |
| aVWAP 2y (anchor May 9, 2025) | $4.03 | Long-term anchor near the cycle low |
| RSI (14) | 73.18 | Overbought (>70); bearish RSI divergence flagged |
| Mansfield RS vs Nasdaq Composite | +201.35 | Outperform, rising; −7.37 vs a week ago, +83.54 vs a month ago |
| MACD (12,26,9) | 1.479 / 1.425 / +0.054 | Golden cross Sep 16; histogram positive but thin |
| ADX (14) | 59.38 (90d) / 59.10 (2y) | Strong trend |
| ATR (14) | $0.92 (6.27% of price) | High volatility — wide daily ranges |
| OBV 2y / 90d | Accumulation / Accumulation | Both above MA20 and rising (MA20 gap 49.02% / 17.06%); no OBV divergence flagged |
| Volume vs 20d avg | 0.863x | 16,970,400 vs 19,660,595 avg; ≈1.27x after adjusting for a 0.681x market median |
| 1× / 2× ATR stop | $13.70 / $12.79 | 2× ATR reference = −12.5% from close |
① Price & Moving Averages
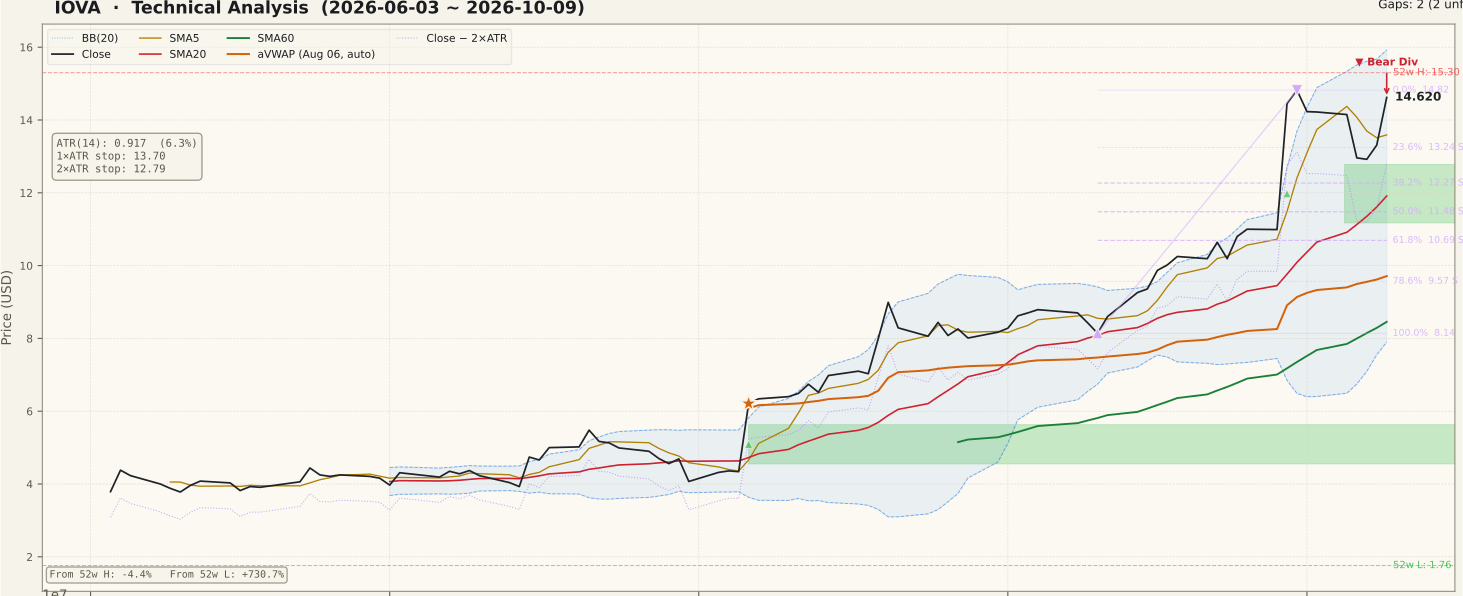
The full bullish stack — close above SMA5 ($13.59), SMA20 ($11.91) and SMA60 ($8.46) — has been in place since August 7, and all three averages are rising. The 90-day chart is a staircase: an August 6 gap, a steady September climb from the $8.14 swing low (Sep 10), then the September 29 guidance gap that printed the $15.30 52-week high and a $14.82 close on September 30. The current Fibonacci swing runs from that $8.14 low to the $14.82 high; the October 6–7 dip closed below the 23.6% retracement ($13.24) at $12.96 and $12.92 — just above the top of the unfilled September 29 gap ($11.17–$12.78), with the October 7 intraday low of $12.31 reaching into it — and October 9 closed back at $14.62. The weak point is distance: the close sits about 23% above SMA20 and 73% above SMA60, so even a normal pullback toward the 20-day average would be a large percentage move.
② Volume

The two volume spikes that define this advance are the August 6 and September 29 gap days (about 4.5x and 5.6x the 20-day average); both are now outside the latest five sessions. Since then volume has normalized: the October 6 decline came on roughly average volume (about 1.0x), and the October 9 rebound printed 16,970,400 shares, 0.863x its 20-day average. The tape was quiet overall — the median stock in our scan universe traded at 0.681x its own average that day — so relative to the market IOVA's participation was somewhat above normal (≈1.27x), but not the kind of surge that confirms a fresh breakout. Volume on any move through $15.30 is the confirmation to look for.
③ MACD

MACD (1.479) has been above its signal line (1.425) since the September 16 golden cross, which came well above zero — a continuation signal rather than an early one. The histogram, however, has shrunk to +0.054: the MACD line rolled over during the October 6–7 dip and came close to the signal line before ticking back up on October 9. That narrowing says upside momentum has slowed after the gap; a cross below the signal line would be the first momentum confirmation of a deeper pause, while a re-widening histogram would mean the October 9 rebound has follow-through.
④ RSI

RSI(14) is 73.18, back above 70 after cooling into the mid-60s during the October 6–7 dip. The chart tool flags a bearish RSI divergence, with its first reference peak on August 20 (price $8.99, RSI 83.31), set against the higher price highs since. A divergence is a caution flag about thinning momentum, not a top call — it only matters if price follows through by failing below recent support. In a trend this strong, RSI can stay above 70 for weeks; the more useful read is whether dips keep holding above 50.
⑤ Mansfield Relative Strength

Relative strength is the reason IOVA is on this list: Mansfield RS vs the Nasdaq Composite is +201.35, deep in outperform territory with a rising slope. Week over week it eased by 7.37 points (from +208.72) — positive but slowing — while month over month it is up 83.54 points (from +117.82), still accelerating on the longer view. The RS line had already been above zero since spring and was climbing through August and September before the guidance gap; the gap added a step, and the past week gave back part of it. A continued slide in RS while the Nasdaq holds would be the first sign of the leadership fading.
⑥ ATR · ADX

ADX at 59.38 marks a strong trend, though it has eased slightly from its early-October level. ATR has stepped up to $0.92, or 6.27% of price — the highest reading on this chart, lifted by the gap and the wide October sessions. That volatility sets the risk math: the 1× ATR reference is $13.70 and the 2× ATR reference is $12.79, about 12.5% below the close and almost exactly at the top of the September 29 gap ($12.78). Position sizing has to absorb daily swings of this size.
⑦ OBV

OBV reads accumulation on both timeframes: above its MA20 and rising on the 2-year view (MA20 gap 49.02%) and on the 90-day view (17.06%). On the 90-day chart OBV dipped after the September 30 peak as the October 6 decline subtracted volume, then turned up again with the October 9 rebound, staying above its rising MA20 throughout. No OBV divergence is flagged. Volume flow therefore still supports the trend; a cross of OBV below its MA20 would be the first volume-based sign of distribution.
Bull vs Bear
Bull Case
- Full bullish stack Close > SMA5 > SMA20 > SMA60 since Aug 7, all averages rising.
- Mansfield RS +201.35 vs the Nasdaq Composite; leadership was built before the Sep 29 event.
- The Oct 6–7 dip closed above the Sep 29 gap top ($12.78), and Oct 9 recovered back above the 23.6% retracement ($13.24).
- OBV in accumulation on both the 2-year and 90-day views; no OBV divergence.
- ADX 59.38 — a strong, established trend; MACD still above its signal line.
- Close only 4.4% below the 52-week high; Sep 30's $14.82 is the highest close in two years.
Bear Case
- Close about 23% above SMA20 and 73% above SMA60 — stretched.
- RSI 73.18 overbought, with a bearish RSI divergence flagged.
- MACD histogram has narrowed to +0.054 — momentum slowing after the gap.
- RS slipped 7.37 points week over week; the gap-driven step is partly fading.
- ATR 6.27% of price; the 2× ATR reference sits 12.5% below the close.
- The unfilled Sep 29 gap ($11.17–$12.78) and the $15.30 high box price in on both sides.
Scenarios
| Scenario | Probability | Path | Trigger / Invalidation |
|---|---|---|---|
| Range digestion | 40% | Price chops between roughly $12.78 and $15.30 while SMA20 rises toward the price and RSI resets toward 60. | Trigger: closes holding above $13.24 with RSI easing. Invalidation: a close below $12.79 (2× ATR). |
| Continuation | 30% | October 9's rebound extends through the $14.82 close high and the $15.30 52-week high. | Trigger: a close above $15.30 on above-average volume and a re-widening MACD histogram. Invalidation: rejection back below $13.70. |
| Gap fill | 30% | Momentum fades and price works into the Sep 29 gap ($12.78 down to $11.17), near SMA20 ($11.91) and the 50% retracement ($11.48). | Trigger: a close below $12.79 with MACD crossing under its signal. Invalidation of the uptrend structure: a close below $11.17. |
Key Levels
| Price | Role | Basis |
|---|---|---|
| $15.30 | Resistance | 52-week high (Sep 29 intraday) |
| $14.82 | Resistance | Sep 30 close / Fibonacci 0% of the swing |
| $14.62 | Current | Oct 9 close |
| $13.24 | Support | Fibonacci 23.6% retracement |
| $12.79 | Stop (2× ATR) | 2× ATR reference; Sep 29 gap top $12.78 just below |
| $12.27 | Support | Fibonacci 38.2% retracement (inside the gap) |
| $11.17 | Support | Sep 29 gap bottom |
What to Watch
- A close above $15.30 on above-average volume — the confirmation the October 9 rebound did not yet provide.
- The MACD histogram: re-widening supports continuation; a cross below the signal line points to a longer pause.
- Whether pullbacks keep holding above the Sep 29 gap top ($12.78) and the $12.79 2× ATR reference.
- Mansfield RS week over week — a second consecutive drop would suggest the leadership is cooling against the Nasdaq Composite.
- OBV staying above its MA20 on the 90-day view.
Conclusion
Past Analyses of This Stock same ticker · newest first
Other signals from this issue same publication date · 5 stocks
This analysis is an educational interpretation of chart data and is not investment advice. Probabilities and levels are subjective estimates; every investment decision, and its outcome, is your own responsibility. Where a stock has moved on a fundamental catalyst, technical signals alone are not a sufficient basis for a purchase decision.
Two Week Swing · twoweekswing.com · 4,600+ stocks screened weekly