AMN Healthcare Services Inc
$40.49 −2.46% from 52-week high $41.51
This analysis is based on closing-price data as of October 16, 2026. Whether you're researching how to buy AMN Healthcare Services Inc stock or you've just opened a brokerage account and are trying to time an entry, here are objective support levels and stop-loss references built from the RSI, MACD and ATR indicators.
Over two years AMN has traced a full round trip: a collapse from the low $40s in late 2024 to a 52-week low of $14.97, then a stair-step recovery through 2026 that has now carried the stock back to $40.49 — its highest close since November 7, 2024. The short-term trigger is a two-session push (Oct 15–16) out of a roughly two-month $33–$37 range, on above-average volume, with relative strength vs the S&P 500 rising sharply. The lens for this setup is stretch: RSI is above 75 and price closed above the upper Bollinger Band, while ADX still reads below 20, so the breakout has momentum but not yet a confirmed trend-strength reading behind it.
Snapshot as of Oct 16, 2026 close · values from chart JSON
| Item | Value | Read |
|---|---|---|
| Close | $40.49 | Highest close since Nov 7, 2024 |
| 52-week high / low | $41.51 / $14.97 | −2.46% from high · +170.5% from low |
| SMA 5 / 20 / 60 | $38.19 / $36.12 / $34.74 | Close > 5 > 20 > 60 (bullish alignment) |
| Bollinger (20) | Upper $39.66 · Mid $36.12 · Lower $32.58 · Width 19.58% | Close above the upper band |
| aVWAP (90d) | $35.16 (anchor Aug 7, 2026) | Price above — short-term buyers in profit |
| aVWAP (2y) | $26.00 (anchor Jan 14, 2026) | Price far above long-term anchor |
| RSI (14) | 75.6 | Overbought zone (>70) |
| Mansfield RS vs the S&P 500 | +53.41% (prev week 37.26 · prev month 35.54) | Outperforming, accelerating |
| MACD (12,26,9) | 1.18 / signal 0.76 / hist +0.42 | Golden cross Sep 16, 2026 |
| ADX (14) | 17.8 | Ranging (<20) — trend strength not confirmed |
| ATR (14) | $1.45 (3.58% of price) | Rising off its low |
| OBV | 2y: early accumulation, flat (+11.95% vs MA20) · 90d: accumulation, rising (+44.4% vs MA20) | Volume flow supportive on both frames |
| Volume | 1,545,800 · 2.155x 20-day avg (717,390) | Breakout day on heavy volume |
| 1× / 2× ATR stop | $39.04 / $37.59 | 2× ATR = −7.16% from close |
① Price & Moving Averages
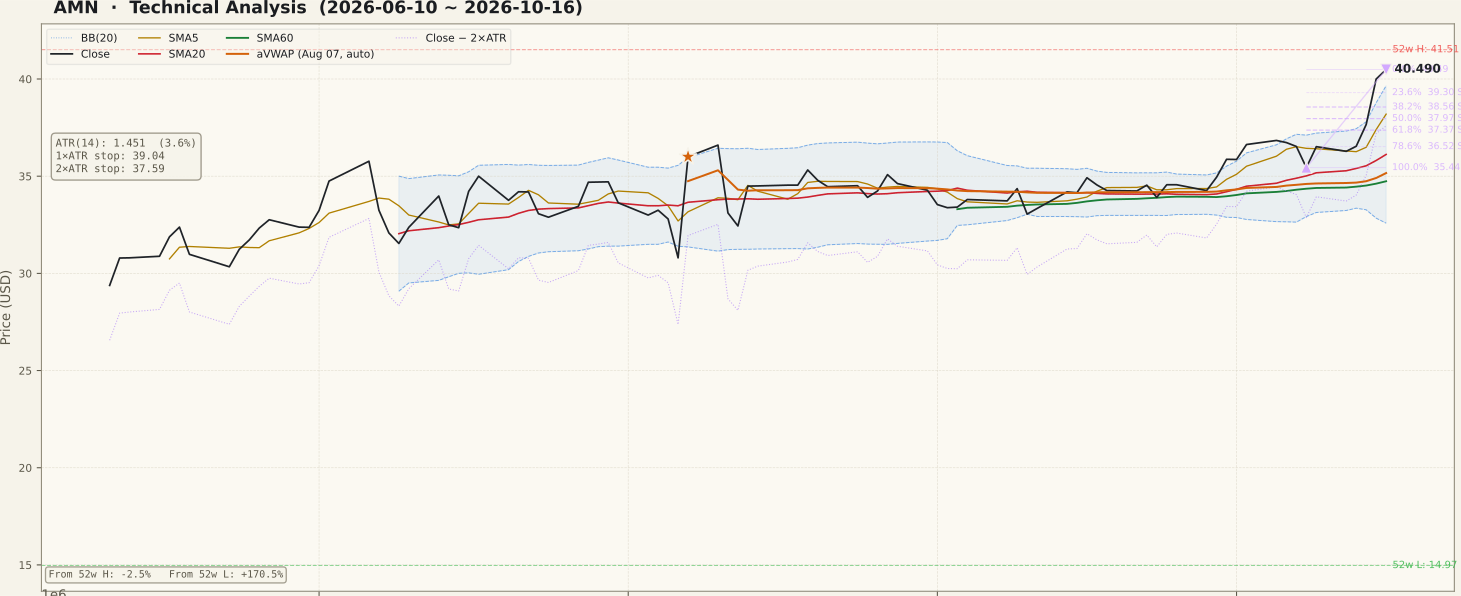
The two-year chart is the key context: AMN traded in the low $40s in late October and early November 2024 before a −29% session on Nov 8, 2024, then spent most of 2025 sliding to the January 2026 low of $14.97. The recovery came in steps — a +27.6% session on Jan 14, 2026 (the 2-year aVWAP anchor), a +29.0% session on May 8, 2026 that left an unfilled gap at $22.81–$24.21, and a +16.9% session on Aug 7, 2026 (the 90-day aVWAP anchor). Those large moves sit well outside the most recent five sessions and are part of how the current trend was built.
On the 90-day frame, price spent August through early October in a roughly $33–$37 box. The SMA5 > SMA20 > SMA60 stack had already formed in August, broke on Sep 2, and re-formed on Sep 17; close has held above the SMA60 since Sep 14 and above the SMA20 since Sep 24. Closes above the prior 20-day high came on Sep 30, Oct 2, Oct 15 and Oct 16, with Oct 15 (+6.21%) carrying price out of the box. In other words, the trend alignment preceded the breakout by about a month rather than being produced by it.
The stretch is visible too: the $40.49 close sits above the upper Bollinger Band ($39.66) and about 12% above the SMA20 ($36.12). The prior price area from late 2024, around $39–$42, is the zone price has now returned to, and the Oct 16 intraday high of $41.51 is the current 52-week high. The short-term Fibonacci swing (Oct 8 low $35.44 to the Oct 16 close $40.49) puts the 38.2% retracement at $38.56 and the 61.8% at $37.37.
② Volume

Volume on Oct 16 was 1,545,800 shares, 2.155x the 20-day average of 717,390 — among the heaviest sessions in the 90-day window, alongside the June and early-August volume spikes. The Oct 15 breakout bar also ran above average (about 1.7x), and both days came while the broad market was quiet (market-wide median volume ratio roughly 0.9x), so the participation looks stock-specific rather than a market-wide tide.
One caution: the Oct 8 down day (−2.98%) also printed about 2.1x volume, so heavy volume has not been one-directional in this window. No company-specific news was identified for Oct 15–16. A breakout on volume is a better-quality signal than one without it, but follow-through volume in the next few sessions is what separates a range expansion from a one-off spike.
③ MACD

MACD crossed above its signal line on Sep 16, 2026 from just above the zero line, and has stayed above it since. The line now reads 1.18 against a signal of 0.76, with the histogram at +0.42 and widening over the last few sessions as price accelerated. That is a strengthening, not a fading, momentum reading.
For context, the 90-day chart shows several whipsaw crosses between July and September while price was boxed in, so a single cross was not reliable in that regime. The current reading differs in that the histogram expansion lines up with price leaving the range.
④ RSI

RSI(14) is 75.6, above the 70 overbought line for the first time since early July 2026. Overbought is a description of how fast price has moved, not a forecast: in strong trends RSI can stay above 70 for extended stretches. Still, it means the stock is short-term stretched, and the early-July episode on this same chart was followed by a pullback back into the range.
No RSI divergence is flagged in the data (divergence field: null), so there is no bearish non-confirmation yet — RSI made a new high alongside price.
⑤ Mansfield RS vs the S&P 500

Mansfield RS vs the S&P 500 is +53.41%, in outperform territory with a rising slope. A week ago it read 37.26 and a month ago 35.54, so the reading improved by +16.15 points over the week and +17.87 points over the month — positive and accelerating on both horizons.
The two-year chart shows how much this has changed: RS sat deep in negative territory (around −60) in late 2024 and only crossed above zero in May 2026. Since then it has held positive, and this week's jump lifts it near the top of its 2026 range. Relative strength is the strongest pillar of this setup.
⑥ ATR · ADX

ATR(14) is $1.45, or 3.58% of price, turning up from the low it reached in early October as the range compressed. That makes the 1× ATR reference $39.04 and the 2× ATR reference $37.59, about 7.2% below the close.
ADX is 17.8, still in the "ranging" band below 20. That is the main technical gap in the setup: price has broken out and momentum indicators agree, but the trend-strength gauge has not caught up. ADX typically lags a fresh range break; a move back above 20–25 in the coming sessions would confirm that a directional trend is forming, while a stall below 20 would fit a wider range rather than a new leg.
⑦ OBV

On the 90-day frame OBV is in "accumulation": above its 20-day average by 44.4% and rising, with the last three sessions pushing it to a new high for the window. On the 2-year frame the state is "early accumulation" — above its MA20 by 11.95% but flat — reflecting that cumulative volume flow has recovered from the 2025 lows but remains well below where it stood before the November 2024 drop.
No OBV divergence is flagged (divergence field: null) on either frame, so volume flow is confirming the price move rather than lagging it.
Bull vs Bear
Bull Case
- Bullish SMA stack (Close > 5 > 20 > 60) re-formed Sep 17, about a month before the breakout.
- Close at $40.49 cleared a two-month $33–$37 range; highest close since Nov 7, 2024.
- Breakout sessions on above-average volume (2.155x on Oct 16) while the market was quiet.
- Mansfield RS +53.41% vs the S&P 500, up 16+ points in a week — accelerating.
- MACD above signal since Sep 16 with a widening histogram.
- OBV in accumulation on the 90-day frame, no divergence on either oscillator.
Bear Case
- RSI 75.6 — short-term overbought; the early-July reading above 70 was followed by a pullback.
- Close above the upper Bollinger Band and ~12% above the SMA20 — stretched.
- ADX 17.8 is still "ranging"; trend strength not confirmed.
- Price is back in the late-2024 $39–$42 zone, where the stock traded before its Nov 2024 collapse.
- Heavy volume also hit the Oct 8 down day; no identified catalyst for Oct 15–16.
- 2× ATR reference ($37.59) sits 7.2% below — a wide band for a short swing.
Scenarios
| Scenario | Probability | Path | Trigger / Invalidation |
|---|---|---|---|
| Breakout extends | 35% | Price holds above the upper band zone and clears the $41.51 52-week high; ADX rises above 20. | Trigger: close above $41.51 with volume above average. Invalidation: close back below $38.56. |
| Pause / retest | 45% | RSI cools from overbought as price pulls back toward the $37.37–$38.56 retracement zone, holding above the SMA20. | Holds if closes stay above $37.59 (2× ATR). Fails on a close below the SMA20 ($36.12). |
| Breakout fails | 20% | Price slips back into the $33–$37 range, turning the move into a false breakout. | Trigger: close below $36.12 (SMA20), then the 90-day aVWAP $35.16. |
Key Levels
| Price | Role | Basis |
|---|---|---|
| $41.51 | Resistance | 52-week high (Oct 16 intraday) |
| $40.49 | Current | Oct 16 close |
| $39.66 | Support | Upper Bollinger Band (breakout edge) |
| $38.56 | Support | 38.2% retracement of Oct 8–16 swing |
| $37.59 | Stop (2× ATR) | Close − 2× ATR ($1.45) |
| $36.12 | Support | SMA20 / Bollinger midline |
| $35.16 | Support | 90-day aVWAP (anchor Aug 7, 2026) |
What to Watch
- Whether price can close above the $41.51 52-week high, or stalls in the late-2024 $39–$42 zone.
- ADX: a move above 20 would confirm trend strength; a stall below it points to a wider range.
- Volume on pullbacks — lighter volume on down days would keep the accumulation reading intact.
- RSI cooling from 75.6 without a close below the SMA20 ($36.12) would be a constructive reset.
- Mansfield RS holding above its prior-week level (37.26) to keep the acceleration in place.
Conclusion
Past Analyses of This Stock same ticker · newest first
Other signals from this issue same publication date · 6 stocks
This analysis is an educational interpretation of chart data and is not investment advice. Probabilities and levels are subjective estimates; every investment decision, and its outcome, is your own responsibility.
Two Week Swing · twoweekswing.com · 4,600+ stocks screened weekly