Avantor, Inc.
$16.42 −0.2% from the 52-week high of $16.45 · +126.0% from the 52-week low of $7.26
This analysis is based on closing-price data as of October 16, 2026. Whether you're researching how to buy Avantor, Inc. stock or you've just opened a brokerage account and are trying to time an entry, here are objective support levels and stop-loss references built from the RSI, MACD and ATR indicators.
Over two years Avantor fell from the low $20s in early 2025 to a 52-week low of $7.26 in late March 2026, then reversed into a steady recovery that has more than doubled the price. Since October 2 the moving averages have been fully stacked (close > SMA5 > SMA20 > SMA60), and Mansfield relative strength is +38.0% vs the S&P 500. On Friday, October 16, the stock closed above the top of its recent range for the first time, at $16.42 on about 3.2× normal volume — the highest close on the chart since March 2025. The breakout is one session old and both RSI and OBV flag a bearish divergence, so this page reads it as a fresh range breakout inside an established trend that still has to prove it can hold.
Snapshot all figures from the chart JSON · as of October 16, 2026
| Close | $16.42 |
|---|---|
| 52-week high / low | $16.45 (−0.2%) / $7.26 (+126.0%) |
| SMA5 / SMA20 / SMA60 | $15.85 / $15.41 / $14.59 — SMA5 > SMA20 > SMA60, bullish alignment; close above all three |
| Bollinger (20) | Upper $16.20 · Mid $15.41 · Lower $14.63 · width 10.16% — close above the upper band |
| aVWAP — 90d | $14.77 (anchor Jul 29, 2026) — price above |
| aVWAP — 2y | $11.47 (anchor Aug 1, 2025) — price above |
| RSI (14) | 68.4 (90d and 2y) — just under 70 · bearish RSI divergence flagged |
| Mansfield RS | +38.0% vs the S&P 500 · outperform · slope rising · prior week 29.08 · prior month 30.77 |
| MACD (12,26,9) | MACD 0.336 · Signal 0.292 · Histogram +0.044 (90d) · golden cross Oct 15, 2026, above zero |
| ADX (14) | 32.7 (2y) / 32.6 (90d) — strong trend (>25, direction-neutral) |
| ATR (14) | $0.47 — 2.85% of price |
| OBV — 2y / 90d | 2y: early accumulation, above MA20, slope flat (spread vs own MA20 17.57%) · 90d: early accumulation, above MA20, slope flat (spread 31.83%) · bearish OBV divergence flagged in both frames |
| Volume | 29,356,100 shares — 3.24× the 20-day average of 9,075,360 (about 3.7× after adjusting for a quiet 0.87× market session) |
| Stop references | 1×ATR $15.95 (−2.9%) · 2×ATR $15.48 (−5.7%) |
① Price & Moving Averages
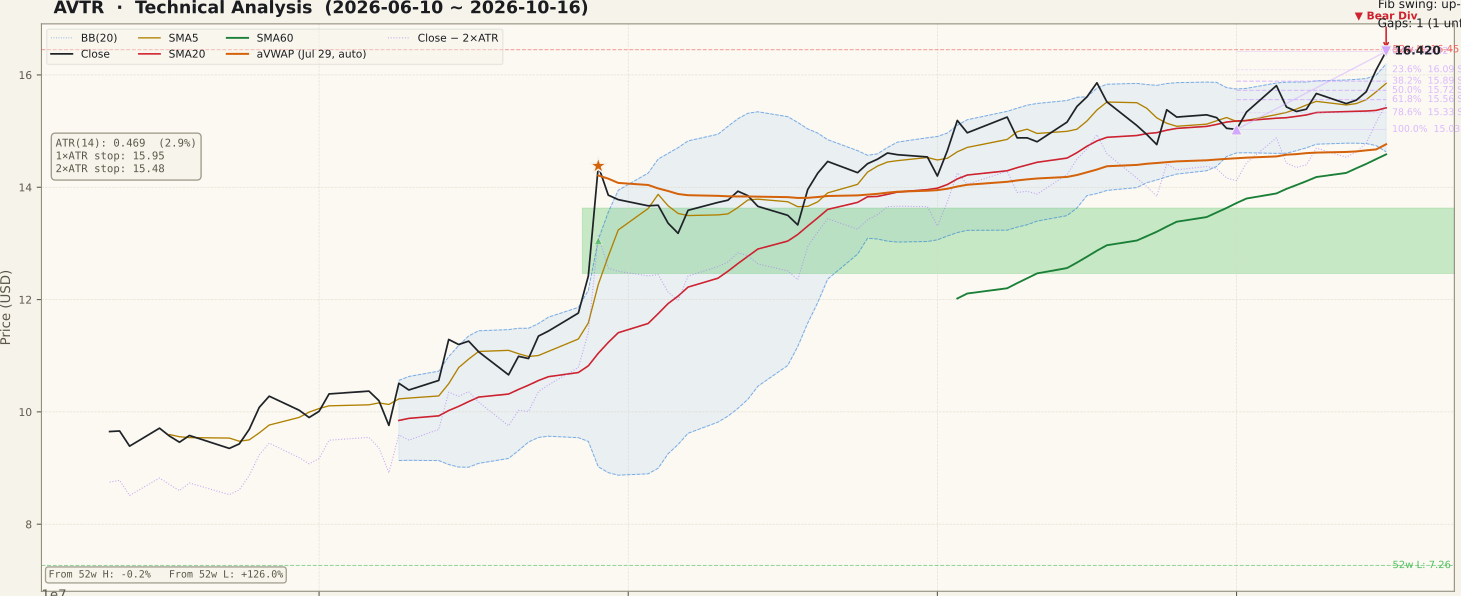
The two-year chart is a decline-then-recovery shape. The stock slid from the low $20s through 2025, broke down again in February 2026, and bottomed at the $7.26 52-week low in late March. From there it turned higher through spring and early summer, jumped 15.8% on July 29 on heavy volume (an event about eleven weeks before the base date, which left an unfilled support gap at $12.47–$13.63), and has climbed in a steadier staircase since. The October 16 close of $16.42 is within 0.2% of the $16.45 52-week high set intraday that same session.
The breakout itself is one session old. For most of the prior four weeks price had been capped in a $15–$16.38 range; the October 6 session reached $16.38 intraday but closed at $15.43. Friday was the first close above that ceiling, up 2.05%. The trend structure came first: SMA5 > SMA20 > SMA60 has held since October 2 (11 sessions), the close has been above SMA20 since October 2, and above SMA60 since late May. The same day as the breakout, Morgan Stanley raised its price target from $14 to $15 while keeping an equal-weight rating — a target still below the current price, so the note is coincident timing rather than an obvious driver. Both anchored VWAPs sit below price ($14.77 on the 90-day frame, $11.47 on the two-year frame).
Two cautions on the price panel. The close is above the upper Bollinger Band ($16.20), which is typical of a breakout bar but often followed by a pause back inside the band. And the 90-day swing that the Fibonacci tool measures runs only from the October 1 low of $15.03 to Friday's $16.42 close, so its retracement levels (23.6% at $16.09, 38.2% at $15.89, 50% at $15.72) are tightly packed just under the price.
② Volume

Breakout-day volume was 29,356,100 shares, 3.24× the 20-day average of 9,075,360. October 16 was a quiet session for the market as a whole — the median stock in our sample traded at about 0.87× its own 20-day average — so on a market-adjusted basis AVTR's participation was closer to 3.7×. That is a genuine, stock-specific volume expansion, which is what a range breakout needs.
The context matters, though. The sessions leading into the breakout were mostly below average, and the climb through September and early October ran on ordinary volume. The breakout is therefore a single heavy bar after a quiet run-up, not the end of a sustained build in participation. The last comparable spike on the panel was July 29. Follow-through volume in the next few sessions will say more than Friday's bar alone.
③ MACD

MACD (0.336) is above its signal line (0.292) with a histogram of +0.044; the last cross was a golden cross on October 15, just two sessions ago, and both lines are above zero. That cross follows a long stretch from mid-August into early October in which MACD drifted down toward its signal line while price kept grinding higher — momentum was cooling even as the trend held.
So the MACD picture is a fresh re-acceleration from a much lower level than the August peak, not a continuation of a strong momentum run. A histogram that keeps widening would confirm the breakout; a quick cross back below the signal line would mark Friday as a one-day push.
④ RSI

RSI stands at 68.4 in both frames, just under the 70 overbought line. Both frames flag a bearish RSI divergence: on September 8 price closed at $15.25 with RSI at 71.31 (90-day frame; 71.24 on the two-year frame), while on October 16 price closed higher at $16.42 with RSI lower at 68.40 (68.39). A higher price high on a lower momentum high is the classic sign that the advance is losing thrust.
A divergence is a possibility, not a verdict — it needs a price reversal to confirm it, and a strong breakout that drives RSI above the September peak would erase it. For now it is the main reason to treat the breakout with patience rather than as a confirmed new leg.
⑤ Mansfield Relative Strength

Mansfield RS is +38.0% vs the S&P 500, tagged outperform with a rising slope, and it reads the same in both frames. It is positive and accelerating on both horizons: up 8.89 points from last week's 29.08 and up 7.19 points from last month's 30.77. Friday's reading is the highest on the panel.
The two-year panel shows how recent this leadership is. RS sat below zero — often deeply so — from early 2025 through mid-2026, and only crossed above zero around the late-July jump. Since then it has stayed positive in a gently rising band and has now pushed to the top of it. That turnaround is why AVTR ranks in the 96th percentile for relative strength in this week's breakout screen.
⑥ ATR & ADX

ATR is $0.47, or 2.85% of price — modest volatility, well below the level reached after the July 29 jump. That sets the objective stop references at $15.95 (1×ATR, −2.9%) and $15.48 (2×ATR, −5.7%). The 2×ATR level sits just above SMA20 ($15.41) and below the top of the old range, so a close there would mean the breakout has failed and price is back inside the range it just left.
ADX is 32.7 on the two-year frame and 32.6 on the 90-day frame — in the "strong trend" zone above 25. On the panel it has eased from the higher readings of August and September, so the trend still has strength but less than at its summer peak. ADX measures strength, not direction; here, with the averages stacked upward, it describes an up-trend that is still intact.
⑦ OBV

Both frames tag OBV as early accumulation — above its 20-day average but with a flat slope. The spreads above that average are 31.83% (90-day) and 17.57% (two-year); those measure distance from OBV's own MA20, not divergence. The 90-day panel shows OBV peaking in mid-September, sagging through early October, and snapping back sharply on Friday's heavy volume.
Even with that jump, both frames flag a bearish OBV divergence: price closed at $15.86 on September 17 and higher at $16.42 on October 16, but OBV was lower on the second peak (90-day frame 165,841,200 vs 161,265,500; the two-year frame shows the same 4,575,700 shortfall on a different running total). Cumulative volume has not yet confirmed the new price high — the same message RSI is sending.
Bull vs Bear
Bull Case
- First close above the four-week range ceiling, at a new 52-week high zone and the highest close since March 2025.
- Breakout volume 3.24× average — about 3.7× after adjusting for a quiet market session.
- SMA5 > SMA20 > SMA60 alignment since October 2, two weeks before the breakout.
- Mansfield RS +38.0% vs the S&P 500, accelerating week over week (+8.89 pts) and month over month (+7.19 pts).
- Fresh MACD golden cross (Oct 15) above zero; ADX 32.6 says the trend has strength.
- Price above both anchored VWAPs ($14.77 90d, $11.47 2y); ATR only 2.85% keeps the stop reference tight.
Bear Case
- The breakout is one session old; a single bar has not yet been tested.
- Bearish RSI divergence: RSI 68.40 on Oct 16 vs 71.31 on Sep 8 at a lower price.
- Bearish OBV divergence: OBV lower at the Oct 16 high than at the Sep 17 high.
- Close above the upper Bollinger Band ($16.20) — stretched in the short term.
- The run-up into the breakout came on mostly below-average volume; MACD momentum had been fading since August.
- A quarterly report is due in the coming weeks, which can override any chart setup.
Scenarios
| Scenario | Probability | Path | Trigger / Invalidation |
|---|---|---|---|
| Breakout holds and extends | 35% | Price holds above the old range ceiling and keeps making higher closes as the trend extends. | Trigger: closes above $16.45 with volume staying above average and the MACD histogram widening. Invalidation: close back below $15.89. |
| Pause and retest | 40% | The stretch above the upper band unwinds into the $15.72–$16.09 retracement zone, near the old range top, before the trend decides. | Holds above SMA20 ($15.41) on a closing basis; RSI stays above 50; MACD stays above its signal. |
| Failed breakout | 25% | The divergences play out: price slips back inside the range and toward SMA20 and the 90-day anchored VWAP. | Close below the 2×ATR stop $15.48; MACD crosses back below its signal. |
Key Levels
| Price | Role | Basis |
|---|---|---|
| $16.45 | Resistance | 52-week high (intraday, Oct 16) |
| $16.42 | Current | Close of Oct 16, 2026 · 0% of the Oct 1 → Oct 16 swing |
| $16.09 | Support | 23.6% retracement of the $15.03 → $16.42 swing |
| $15.89 | Support | 38.2% retracement of the same swing |
| $15.72 | Support | 50% retracement of the same swing |
| $15.48 | Stop (2×ATR) | Objective invalidation, −5.7% from the close |
| $15.41 | Support | SMA20 / Bollinger mid-band |
Other references: the upper Bollinger Band ($16.20) and the 1×ATR stop ($15.95) sit inside the retracement zone; the 90-day anchored VWAP is $14.77 and SMA60 $14.59; the unfilled July 29 support gap spans $12.47–$13.63.
What to Watch
- Follow-through after a one-day breakout. Closes holding above $16.09 in the next few sessions would show the range ceiling turning into support.
- The divergences. A new high with RSI above the September 71.31 reading and OBV above its September peak would cancel them; a reversal from here would confirm them.
- Volume. Up days staying above the 9,075,360 average support the breakout; heavy down days would suggest Friday's buyers are leaving.
- The quarterly report. Expected around late October or early November — check the confirmed date; results can move the stock more than any level on this page.
- The 2×ATR stop at $15.48. A close below puts price back inside the old range and marks the breakout as failed.
Conclusion
Past Analyses of This Stock same ticker · newest first
Other signals from this issue same publication date · 6 stocks
This analysis is an educational interpretation of chart data and is not investment advice. Probabilities and levels are subjective estimates; every investment decision, and its outcome, is your own responsibility. All figures are derived from closing-price data through October 16, 2026 and are not updated after publication.
Two Week Swing · twoweekswing.com · 4,600+ stocks screened weekly