Iovance Biotherapeutics, Inc.
$14.22 −7.1% from 52-week high · +708.0% from 52-week low
This analysis is based on closing-price data as of October 2, 2026. Whether you're researching how to buy Iovance Biotherapeutics, Inc. stock or you've just opened a brokerage account and are trying to time an entry, here are objective support levels and stop-loss references built from the RSI, MACD and ATR indicators.
Snapshot as of Oct 2, 2026 close
| Item | Value | Note |
|---|---|---|
| Close | $14.22 | Sep 30 close $14.82 = highest close of the 2-year window |
| 52-week high / low | $15.30 / $1.76 | −7.1% / +708.0%; the high is the Sep 29 intraday print |
| SMA 5 / 20 / 60 | $13.74 / $10.65 / $7.68 | Close > SMA5 > SMA20 > SMA60 (stack in place since Aug 7) |
| Bollinger (20) | $14.89 / $10.65 / $6.40 | Width 79.71% — very wide; close near upper band |
| aVWAP 90d (anchor Aug 6, 2026) | $9.33 | Short-term holders since the August gap are well in profit |
| aVWAP 2y (anchor May 9, 2025) | $3.90 | Long-term anchor near the cycle low |
| RSI (14) | 79.91 | Overbought (>70); no divergence flagged |
| Mansfield RS vs Nasdaq Composite | +208.72 | Outperform, rising; +56.56 vs a week ago, +84.04 vs a month ago |
| MACD (12,26,9) | 1.638 / 1.249 / +0.389 | Golden cross Sep 16; histogram positive |
| ADX (14) | 63.85 | Strong trend |
| ATR (14) | $0.85 (5.96% of price) | High volatility — wide daily ranges |
| OBV 2y / 90d | Accumulation / Accumulation | Both above MA20 and rising (MA20 gap 218.37% / 49.56%) |
| Volume vs 20d avg | 0.646x | Quiet Oct 2 session (≈0.74x after adjusting for a 0.875x market median) |
| 1× / 2× ATR stop | $13.37 / $12.53 | 2× ATR reference = −11.9% from close |
① Price & Moving Averages
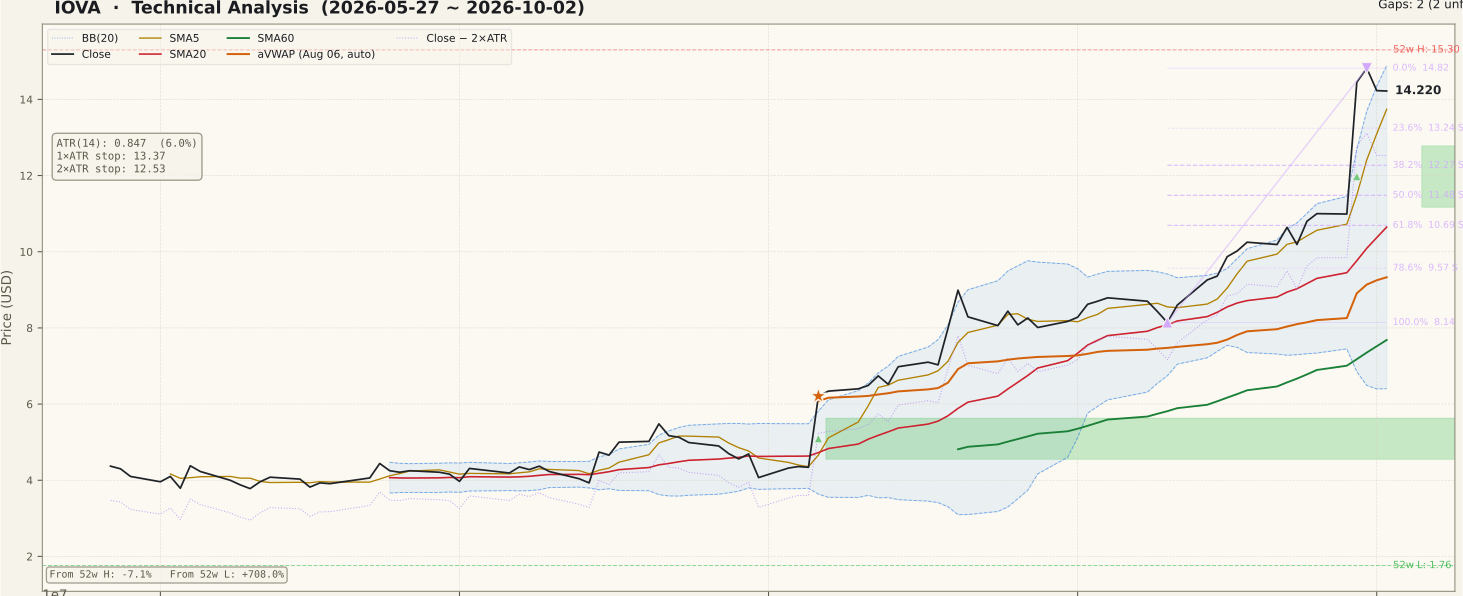
The trend structure is unambiguous: close $14.22 sits above SMA5 $13.74, SMA20 $10.65 and SMA60 $7.68, and that bullish ordering has held since August 7. The 90-day chart shows a staircase of advances — July 15 (+20.6%), the August 6 gap (+43.1% on about 4.5x volume, the 90-day aVWAP anchor), and then the September 29 guidance gap (+31.48%) — separated by sideways pauses rather than steady drift. The close is about a third above SMA20, which is a stretched distance by any measure, and the Bollinger Band width of 79.71% says the recent range is unusually wide.
The Fibonacci grid is drawn on the up-swing from the Sep 10 low $8.14 (100%) to the Sep 30 high $14.82 (0% of the swing). The 23.6% retracement at $13.24 is the first support; the 38.2% ($12.27) and 50% ($11.48) retracements both sit inside the still-unfilled September 29 gap ($11.17–$12.78). Above, the 52-week high of $15.30 and the Sep 30 close of $14.82 form the nearby ceiling. An older unfilled gap from August 6 ($4.55–$5.63) lies far below.
② Volume

The volume history is dominated by event spikes: the 78.2 million shares traded on September 29 (about 5.6x the 20-day average) is the tallest bar in the 90-day window, with the August 6 bar close behind. Follow-through volume faded quickly — 29.3 million on Sep 30, 16.0 million on Oct 1 and 11.9 million on Oct 2, a 0.646x ratio to the 20-day average of 18.43 million. Against a market where the median stock traded about 0.875x its own average that day, IOVA's Friday session was quiet even after adjustment (≈0.74x).
Quiet volume after a gap is a neutral-to-constructive sign when price holds, because it suggests holders are not rushing out. But it also means the last two red candles have not been tested by heavy supply or demand; the next high-volume session will say more about which side controls the gap zone.
③ MACD

MACD 1.638 is above its signal line 1.249 with a histogram of +0.389; the most recent golden cross came on September 16, well above the zero line, after a brief early-September dead cross that resolved without a meaningful price breakdown. The line steepened sharply on the September 29 gap. The chart suggests histogram bars have stopped expanding over the last session or two, which is typical as a gap ages; a shrinking histogram is a loss of acceleration, not a reversal on its own.
④ RSI

RSI is 79.91, firmly overbought, and the 90-day panel shows it has spent most of August and September above 70. Persistent overbought readings are characteristic of strong trends rather than an automatic warning, and no RSI divergence is flagged in either timeframe (the divergence fields are null). Still, the reading means a large part of the recent move is already in price; a slide back toward 60–70 while price holds above the gap would be a healthy reset, while a drop below 50 would signal that momentum has genuinely cooled.
⑤ Mansfield RS

Relative strength is the reason this stock occupies this issue's relative-strength slot. Mansfield RS vs the Nasdaq Composite is +208.72, up from +152.16 a week earlier and +124.68 a month earlier — positive and accelerating on both horizons. Importantly, the leadership predates the guidance event: RS was already above +120 a month ago, and the 2-year panel shows the line crossing above zero back in early 2026 and ratcheting higher since. The jump in the final week, however, is mostly the September 29 gap, so part of today's reading is a single-session effect.
⑥ ATR · ADX

ADX at 63.85 describes a very strong trend (ADX measures strength, not direction). ATR is $0.85, or 5.96% of price, and the panel shows it stepping up abruptly on the gap day. That matters for risk sizing: the 1× ATR reference is $13.37 and the 2× ATR reference is $12.53, about 11.9% below the close. A normal two-day wobble in this stock can easily cover one ATR, so tight references are likely to be triggered by noise.
⑦ OBV

OBV reads Accumulation on both timeframes: above its 20-day average and rising in the 2-year view (MA20 gap 218.37%) and in the 90-day view (49.56%). Those percentages measure distance from the moving average, not divergence; the OBV divergence field is null on both timeframes. On the 2-year panel OBV has recovered the entire 2024–25 drawdown and now sits at the top of its two-year range, which confirms that the price recovery has been carried by net buying volume rather than thin trading. The last two sessions dipped OBV slightly, in line with the two small down days.
Bull vs Bear
Bull Case
- Full bullish stack: close > SMA5 > SMA20 > SMA60, in place since Aug 7.
- Mansfield RS +208.72 vs the Nasdaq Composite, accelerating on week and month.
- Relative-strength leadership existed before the Sep 29 event (RS +124.68 a month ago).
- MACD golden cross Sep 16 above zero; histogram positive.
- OBV in accumulation on both 2y and 90d — volume confirms the recovery.
- Sep 30 close $14.82 is the highest close in two years; an unfilled gap ($11.17–$12.78) sits below as support.
Bear Case
- The latest leg is a single guidance-driven gap (+31.48%), not a gradual trend advance.
- RSI 79.91 is overbought; much of the move is already priced.
- Close is roughly a third above SMA20 — stretched, with room for mean reversion.
- ATR 5.96% of price: the 2× ATR reference is almost 12% away.
- Unfilled gaps often attract price; a fill would mean a drop toward $11.17–$12.78.
- The 52-week high $15.30 and Sep 30 close $14.82 cap price just overhead.
Scenarios
| Scenario | Probability | Path | Trigger / Invalidation |
|---|---|---|---|
| Gap retest | 40% | Price drifts back into the Sep 29 gap ($12.78 → $12.27 38.2% → $11.48 50%) as overbought RSI resets. | Trigger: close below $13.24 (23.6%). Holding the gap bottom $11.17 keeps the broader uptrend intact; closing below it means the gap failed. |
| Sideways digestion | 35% | A range roughly between $13.24 and $14.82 while SMA20 catches up and RSI cools. | Trigger: low-volume days holding above $13.24. Invalidation: close below the 2× ATR reference $12.53. |
| Continuation | 25% | Close above $14.82 and then the $15.30 52-week high on expanding volume. | Trigger: close above $15.30 with volume above the 20-day average. Invalidation: an upside break on sub-average volume that falls back below $14.82. |
Key Levels
| Price | Role | Basis |
|---|---|---|
| $15.30 | Resistance | 52-week high (Sep 29 intraday) |
| $14.82 | Resistance | Sep 30 close · 0% of the Fibonacci swing · highest 2-year close |
| $14.22 | Current | Oct 2 close |
| $13.24 | Support | 23.6% retracement of the Sep 10–Sep 30 swing |
| $12.78 | Support | Top of the unfilled Sep 29 gap |
| $12.53 | Stop reference | 2× ATR below close (−11.9%) |
| $11.17 | Support | Bottom of the unfilled Sep 29 gap (50% retracement $11.48 inside the gap) |
What to Watch
- Whether the Sep 29 gap ($11.17–$12.78) holds on any pullback — a full fill below $11.17 would turn the event leg into a failed breakout.
- Volume on the next push toward $14.82–$15.30: above-average volume confirms demand; thin volume makes a breakout suspect.
- RSI cooling from 79.91 toward 60–70 while price holds above $13.24 would be a constructive reset; RSI below 50 would not.
- Mansfield RS week-over-week: a drop below +152 would mean the guidance-gap boost is fading relative to the Nasdaq Composite.
- OBV staying above its MA20 — a cross below would be the first volume-based sign of distribution.
Conclusion
Past Analyses of This Stock same ticker · newest first
Other signals from this issue same publication date · 6 stocks
This analysis is an educational interpretation of chart data and is not investment advice. Probabilities and levels are subjective estimates; every investment decision, and its outcome, is your own responsibility. Where a stock has moved on a fundamental catalyst, technical signals alone are not a sufficient basis for a purchase decision.
Two Week Swing · twoweekswing.com · 4,600+ stocks screened weekly