Kestra Medical Technologies, Ltd.
$27.24 −9.2% from the 52-week high of $30.00
This analysis is based on closing-price data as of October 16, 2026. Whether you're researching how to buy Kestra Medical Technologies, Ltd. stock or you've just opened a brokerage account and are trying to time an entry, here are objective support levels and stop-loss references built from the RSI, MACD and ATR indicators.
Over its roughly 19-month trading history KMTS has swung through wide ranges — a high of $30.00 in October 2025, a low of $17.34 in April 2026 — and since July it has been rebuilding toward the top of that range, now sitting 9.2% below the high and 57.1% above the low. The short-term picture is a trend pullback: the moving averages are stacked bullishly (Close > SMA5 > SMA20 > SMA60) and relative strength is positive versus the Nasdaq Composite, but the stack was restored by a single +12.6% session on Oct 15 with no identified catalyst, flanked by −5% sessions on either side. RSI and OBV both flag bearish divergence and MACD sits fractionally below its signal line, so this is a constructive structure that has not yet proved itself.
Snapshot as of Oct 16, 2026 close
| Item | Value | Read |
|---|---|---|
| Close | $27.24 | −5.0% on the day after a +12.6% session |
| 52-week high / low | $30.00 / $17.34 | −9.2% from high · +57.1% from low |
| SMA5 / SMA20 / SMA60 | $27.05 / $26.93 / $25.95 | Bullish stack; close above all three |
| Bollinger (20, 2) | $29.16 / $26.93 / $24.70 | Width 16.54%; close just above the midline |
| aVWAP (90d · 2y) | $26.21 (anchor Sep 15, 2026) · $23.76 (anchor Dec 3, 2025) | Close above both anchors |
| RSI (14) | 52.8 | Neutral level; bearish divergence flagged |
| Mansfield RS vs the Nasdaq Composite | +5.73% | Outperforming, rising (+5.70 pts w/w, +12.79 pts m/m) |
| MACD (12,26,9) | 0.385 vs signal 0.392 · hist −0.006 | Dead cross Oct 8; line pressing back on the signal |
| ADX (14) | 17.4 (90d) · 17.0 (2y) | Ranging — no strong trend |
| ATR (14) | $1.57 (5.77% of price) | High daily volatility |
| OBV (2y · 90d) | −5.9% vs MA20 · −16.08% vs MA20 | Early distribution on both; slope flat; bearish divergence |
| Volume vs 20-day avg | 1.66x (521,900 vs 314,695) | Heaviest recent volume came on a down day |
| 1× / 2× ATR stop | $25.67 / $24.10 | 2× ATR reference is 11.5% below the close |
① Price & Moving Averages
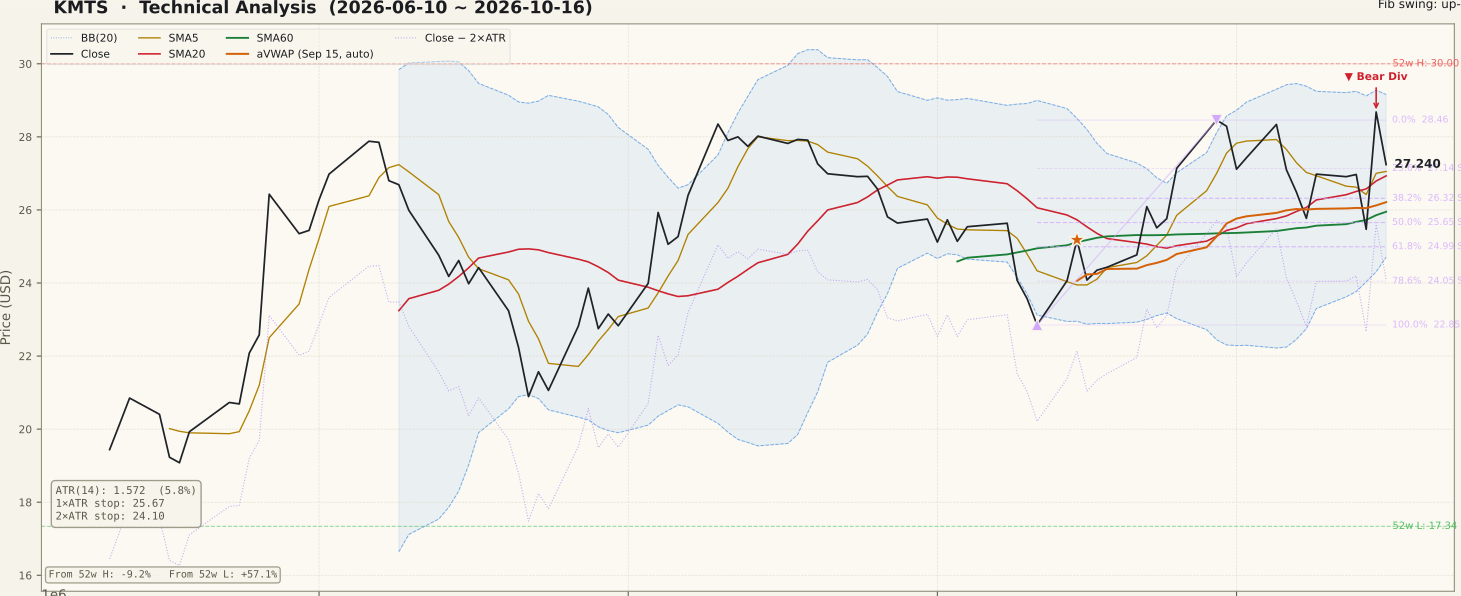
On the two-year chart, KMTS spent late 2025 near its $30.00 high, slid to the $17.34 low in April 2026, and has climbed back since July, with the SMA60 turning up underneath. In the last four weeks the stock rallied from the Sep 11 swing low of $22.85 to $28.46 on Sep 29; the SMA5 > SMA20 > SMA60 stack first formed on Sep 30 and held through Oct 13. It broke for one session on Oct 14, when a −5.6% day pushed the close to $25.47, below both the SMA20 and SMA60, and was restored on Oct 15 by a single +12.6% session to $28.68. No company press release or filing was identified for Oct 15, so the current alignment rests on that one session; Oct 16 then gave back 5.0% to $27.24.
The Fibonacci retracement of the Sep 11–Sep 29 up-swing places the 23.6% level at $27.14 just under the close, with 38.2% at $26.32 and 50% at $25.65. The close sits a little above the Bollinger midline ($26.93) and above the 90-day aVWAP at $26.21, meaning buyers since the Sep 15 anchor are, on average, in profit. Above, the $28.46 swing high and the $30.00 52-week high are the reference resistance.
② Volume

Friday's 521,900 shares were 1.66x the 20-day average of 314,695 — and that volume came on the −5.0% down day, not on the +12.6% rally the day before, which drew only about 1.2x average. A large up move on near-average volume followed by a down day on above-average volume is the weaker ordering of the two: the advance was not confirmed by participation, and the giveback was.
Context matters here. Market-wide volume was light on both days, so the Oct 15 rally was not a high-participation event by the standards of the broad tape either. The yellow spike cluster in mid-September on the chart came with little price progress and sits outside the recent window.
③ MACD

MACD is 0.385 against a signal line of 0.392, leaving a histogram of −0.006 — effectively touching. The last cross was a dead cross on Oct 8, after the line had been above the signal since a late-September golden cross. Both lines remain above zero, so the medium-term momentum backdrop is positive, but the short-term impulse has flattened. A fresh golden cross from here would be the first momentum confirmation of the Oct 15 move; it has not happened yet.
④ RSI

RSI stands at 52.8 — neutral, neither stretched nor washed out. The more important read is the bearish divergence: price closed at $26.09 on Sep 22 with RSI at 65.89, then made a higher close of $28.68 on Oct 15 with RSI only 59.41 (90-day chart; the two-year chart shows the same pair at 65.82 and 59.40). A higher price on weaker momentum suggests the Oct 15 push had less force behind it than the September advance. A divergence marks a possibility, not a confirmed top — it needs follow-through, such as a close back below the SMA20, before it means more.
⑤ Mansfield Relative Strength vs the Nasdaq Composite

Mansfield RS vs the Nasdaq Composite is +5.73%, above zero and rising. A week ago it was +0.04% and a month ago −7.05%, so it has improved 5.70 points week over week and 12.79 points month over month — positive and accelerating on both horizons. The line, however, has oscillated around zero for most of the past three months rather than holding a steady lead; the latest jump is largely the Oct 15 session. Outperformance is real but young.
⑥ ATR & ADX

ATR is $1.57, or 5.77% of price, and has turned up sharply over the last few sessions as the −5.6% / +12.6% / −5.0% sequence widened daily ranges. That puts the 1× ATR reference at $25.67 and the 2× ATR reference at $24.10, about 11.5% below the close — a wide band that reflects how volatile this stock is. ADX at 17.4 (17.0 on the two-year chart) is in ranging territory: despite the bullish moving-average stack, there is no strong directional trend by this measure.
⑦ OBV

OBV reads early distribution on both timeframes: below its 20-day average with a flat slope, −5.9% from the MA20 on the two-year chart and −16.08% on the 90-day chart. The OBV divergence field is bearish and uses the same two dates as RSI — on the 90-day chart OBV was 4,571,600 at the Sep 22 close of $26.09 and only 3,505,300 at the higher Oct 15 close of $28.68 (two-year chart: 10,711,400 and 9,645,100). Volume flow has not kept pace with price. Over the longer arc, two-year OBV has trended higher since September 2025, so this is a short-term non-confirmation within a longer accumulation trend.
Bull vs Bear
Bull Case
- Moving averages stacked Close > SMA5 > SMA20 > SMA60, with the SMA60 rising.
- Mansfield RS +5.73% vs the Nasdaq Composite, up 5.70 points in a week and 12.79 in a month.
- Close above both the 90-day aVWAP ($26.21) and the two-year aVWAP ($23.76).
- MACD and signal both above zero; the histogram is near zero, close to a fresh golden cross.
- Only 9.2% below the $30.00 52-week high after a 57.1% recovery from the April low.
- Two-year OBV has trended higher since September 2025.
Bear Case
- The current alignment was restored by one +12.6% session with no identified catalyst.
- That session drew only ~1.2x average volume; the following −5.0% day drew 1.66x.
- Bearish divergence on both RSI (65.89 → 59.41) and OBV between Sep 22 and Oct 15.
- MACD slipped below its signal on Oct 8 and has not re-crossed.
- ADX 17.4 — no strong trend; the stock has been whipping inside a range.
- ATR 5.77% of price; the 2× ATR reference is 11.5% away.
Scenarios
| Scenario | Probability | Path | Trigger / Invalidation |
|---|---|---|---|
| Range digestion | 40% | Price chops between roughly $25.95 (SMA60) and $28.46 while the averages catch up and the divergence resolves. | Holds above the SMA60 on closing basis; invalidated by a close below $25.95. |
| Pullback deepens | 35% | The divergences play out; price loses the SMA20 and SMA60 and retraces toward the 50%–61.8% Fibonacci zone ($25.65–$24.99). | Close below $25.95 on above-average volume; a close below $24.10 (2× ATR) breaks the setup. |
| Breakout attempt | 25% | Price clears the $28.46 swing high and tests the $30.00 52-week high. | Close above $28.46 on volume above the 20-day average plus a MACD golden cross; failure back under $26.93 negates it. |
Key Levels
| Price | Role | Basis |
|---|---|---|
| $30.00 | Resistance | 52-week high (Oct 27, 2025) |
| $28.46 | Resistance | Sep 29 swing high · Fibonacci 0% of the 90-day swing |
| $27.24 | Current | Oct 16 close |
| $26.93 | Support | SMA20 · Bollinger midline |
| $26.21 | Support | 90-day aVWAP (anchor Sep 15) |
| $25.95 | Support | SMA60 |
| $24.10 | Stop (2× ATR) | Close − 2 × ATR(14) |
What to Watch
- Whether closes hold above the SMA60 ($25.95) — a close below it would undo the alignment for the second time in a week.
- A MACD golden cross; the histogram is at −0.006, so one firm session can flip it.
- Volume on up days versus down days — the Oct 15 rally needs follow-through at above-average volume to look like more than a one-day move.
- Whether OBV can climb back above its 20-day average, which would ease the bearish divergence.
- Any company news that explains the Oct 15 move; none was identified at publication.
Conclusion
Past Analyses of This Stock same ticker · newest first
Other signals from this issue same publication date · 6 stocks
This analysis is an educational interpretation of chart data and is not investment advice. Probabilities and levels are subjective estimates; every investment decision, and its outcome, is your own responsibility. A bottoming or bullish chart signal is not a buy signal on its own.
Two Week Swing · twoweekswing.com · 4,600+ stocks screened weekly