Iovance Biotherapeutics, Inc.
$11.00 −1.2% from the 52-week high of $11.13 · +525.0% from the 52-week low of $1.76
This analysis is based on closing-price data as of September 25, 2026. Whether you're researching how to buy Iovance Biotherapeutics, Inc. stock or you've just opened a brokerage account and are trying to time an entry, here are objective support levels and stop-loss references built from the RSI, MACD and ATR indicators.
Two years ago this stock was trading above $12, and by mid-2025 it had fallen to a 52-week low of $1.76. It spent most of the following year basing near $2 to $4, and then turned sharply in summer 2026: the current close of $11.00 is +525.0% above that low and only 1.2% under the 52-week high of $11.13, printed intraday on the base date. The Mansfield relative strength of +152.2% against the Nasdaq Composite is extreme, and it is built to a large degree on one session — the +43.1% move of August 6, 2026. The trend that followed has held for roughly seven weeks with a full SMA5 > SMA20 > SMA60 stack, and the stock broke to a fresh 20-day high on September 24. The counterweights are just as concrete: RSI at 74.4 carries a flagged bearish divergence, the recent advance came on volume only modestly above market level, and the close now sits inside an unfilled gap from November 2024.
Snapshot all figures from the chart JSON · as of September 25, 2026
| Close | $11.00 |
|---|---|
| 52-week high / low | $11.13 (−1.2%) / $1.76 (+525.0%) |
| SMA5 / SMA20 / SMA60 | $10.56 / $9.30 / $6.90 — Close > SMA5 > SMA20 > SMA60, full bullish alignment |
| Bollinger (20) | Upper $11.26 · Mid $9.30 · Lower $7.34 · width 42.19% |
| aVWAP — 90d | $8.20 (anchor Aug 6, 2026) — price above |
| aVWAP — 2y | $3.62 (anchor May 9, 2025) — price above |
| RSI (14) | 74.4 — overbought zone · bearish divergence flagged (Aug 20 $8.99 / RSI 83.15 → Sep 25 $11.00 / RSI 77.2) |
| Mansfield RS | +152.2% vs the Nasdaq Composite · outperform · slope rising · prior week 148.91 · prior month 120.03 |
| MACD (12,26,9) | MACD 0.940 · Signal 0.864 · Histogram +0.076 · golden cross Sep 16, 2026 |
| ADX (14) | 56.1 — strong trend (direction-neutral) |
| ATR (14) | $0.58 — 5.3% of price |
| OBV — 2y / 90d | Accumulation, above MA20, slope rising in both frames · no OBV divergence flagged in either frame |
| Volume | 12,619,000 shares — 0.92× the 20-day average of 13,732,205 (approx. 1.13× after adjusting for a quiet market session) |
| Stop references | 1×ATR $10.42 (−5.3%) · 2×ATR $9.84 (−10.5%) |
① Price & Moving Averages
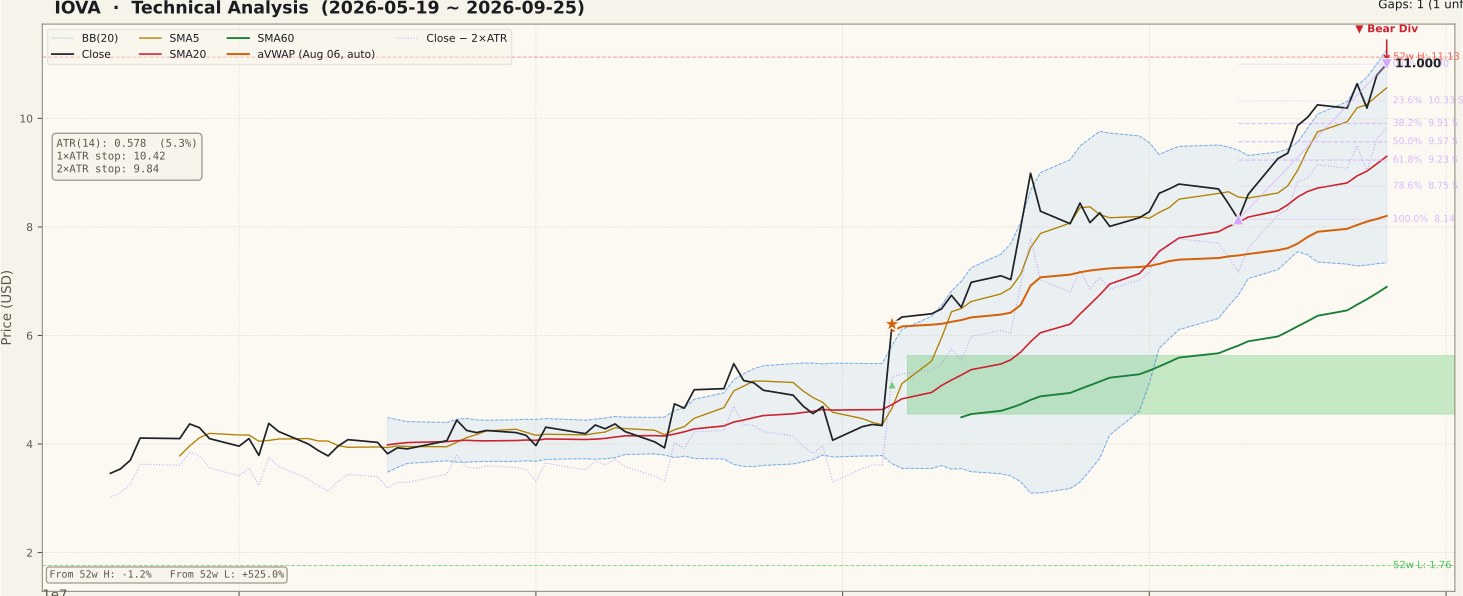
The moving-average stack is complete and well established. The close of $11.00 sits above SMA5 ($10.56), SMA5 above SMA20 ($9.30), and SMA20 above SMA60 ($6.90). Each condition has its own formation date, and they are not recent: SMA20 has been above SMA60 since June 1 (82 sessions), the close has held above SMA60 since August 3 and above SMA20 since August 6, and SMA5 has been above SMA20 since August 7 (35 sessions). The only new element is the 20-day-high breakout, which dates from September 24 — two sessions old at the base date.
The panel shows how this structure was built. A flat base between roughly $4 and $5 through June and July was broken by a +20.6% session on July 15 and then decisively by the +43.1% session on August 6, which left an unfilled support gap between $4.55 and $5.63. Both moves lie well outside the five-session review window and are described here as the history of the advance. Since August the path has been a staircase: a push to $8.99 on August 20, a sideways September with a swing low of $8.14 on September 10, and a climb to $11.00. Price is pressing the upper Bollinger band ($11.26) with the bands wide at 42.19%, and it is well above the 90-day anchored VWAP at $8.20 (anchored August 6, 2026). On the two-year chart, the close has moved into an unfilled resistance gap dated November 8, 2024, spanning $10.80 to $12.10 — the stock is now trading inside old supply from its late-2024 decline.
② Volume

The final bar traded 12,619,000 shares against a 20-day average of 13,732,205 — a sidecar ratio of 0.92×. That needs one market adjustment. September 25 was a quiet session across the screened universe: the median 20-day volume ratio that day was 0.815× (400-ticker sample), and 0.904× on September 24. Divided by the market median, the stock's own ratio is roughly 1.13× — modestly above ordinary, not a surge. A second distortion runs the other way: the 20-day denominator contains September 18, quadruple witching and the S&P quarterly rebalance trade date, when the market median ratio was 1.785×. That session lifts the average slightly and makes every subsequent raw ratio look a little lower than it otherwise would.
Across the last seven sessions the pattern is consistent: 1.62× and 1.53× raw on September 17 and 18 (the latter below the market's own 1.785× that day), then 0.89× on the +5.99% session of September 24 and 0.94× on the +1.85% close of September 25. The breakout to a new 20-day high therefore happened on below-average raw volume. That is not a disqualifying fact for a trend that is already seven weeks old, but it means the last leg is not volume-confirmed. The real volume events on this chart are the July and August spikes — the August 6 bar is the tallest on the panel by a wide margin.
③ MACD

MACD reads 0.940 against a signal line at 0.864, a histogram of +0.076, with the last crossing a golden cross on September 16, 2026. Both lines are far above zero, which places this in the continuation phase of an established trend rather than an early turn. The September 16 cross reversed a brief dead cross from earlier in the month, when the stock drifted sideways and MACD dipped under its signal.
The detail worth noticing is the size of the histogram. At +0.076 it is small compared with the bars of mid-to-late August, and MACD itself is only now returning to the area of its August peak near 0.95 even though price is roughly $2 higher than it was then. Momentum is positive, but it is not expanding at the rate price is. That fits the RSI picture in the next section and is a common feature of the later stages of a strong advance.
④ RSI

RSI(14) is 74.4, inside the overbought zone above 70. In a trend with ADX above 50 that reading on its own is not unusual — RSI has spent much of the period since August 6 above 70. The more specific finding is the flagged bearish divergence: on August 20 price peaked at $8.99 with RSI at 83.15, and on September 25 price made a higher high at $11.00 while RSI reached only 77.2. Higher price, lower oscillator — the textbook regular bearish divergence.
A divergence is a possibility of a turn, not a confirmation of one. Strong trends regularly print one or more bearish divergences and keep going, and it would take a follow-through event — a close back below SMA5 or a loss of the 23.6% retracement at $10.33 — to turn this warning into something structural. What the divergence does establish is that the push from $8.14 to $11.00 carried less internal momentum than the August leg. Combined with below-average raw volume on the breakout, the latest advance is the thinner part of this trend.
⑤ Mansfield Relative Strength

Mansfield RS reads +152.2% versus the Nasdaq Composite, the correct benchmark for a Nasdaq listing, with state "outperform" and slope rising. That is why the stock sits at the top of the relative-strength bucket in this week's screen. Relative strength is anchor-free, so the two-year and 90-day frames report the identical figure. On the two-year panel the line crossed above zero only in early 2026, after more than a year of underperformance through the 2025 decline.
The rate of change is positive on both horizons. Against the prior week's 148.91 the reading is +3.26 points higher, and against the prior month's 120.03 it is +32.13 points higher — positive territory and accelerating in both cases. The context matters, though: the single largest step in the RS line is the August 6 session, when it jumped from the 25 area to about 80. A large part of the +152.2% therefore reflects that one day. Since then RS has kept rising, which shows the gain was extended rather than given back, but a reading this high is as much a record of August 6 as of the last few weeks.
⑥ ATR & ADX

ATR(14) is $0.58, or 5.3% of price. The last week illustrates what that means in practice: −4.23% on September 23 followed by +5.99% on September 24, both within about one ATR. The stop arithmetic follows directly — the 1×ATR reference sits at $10.42 (−5.3%) and the objective 2×ATR reference at $9.84 (−10.5%). Any stop tighter than about $10.42 is inside a single normal session and would be exposed to routine noise.
ADX(14) is 56.1, well above the 25 threshold for a strong trend. ADX measures persistence, not direction; here the trend is plainly upward, so the reading confirms that the advance has been one-directional. Readings above 50 are uncommon and tend to occur late in sharp moves; they do not predict a top, but they do say the trend is already mature rather than forming.
⑦ OBV

On-balance volume agrees with price in both frames. The 90-day frame shows OBV at 265,013,500 against an MA20 of 190,238,800 — 39.31% above its own average — tagged accumulation, above MA20, slope rising. The two-year frame shows the same state: 73,653,200 against an MA20 of −1,121,500, accumulation, rising. The two-year spread figure (6,667.38%) is not meaningful because the MA20 sits near zero, so it is not used here. On the long panel, OBV has climbed out of a deep trough and is now at its highest level of the two-year window.
That spread figure measures accumulation intensity against the MA20; it is not a divergence reading. The
sidecar reports obv.divergence as null in both frames, so no OBV divergence
is flagged. This produces a split between the two oscillators that should be stated as it is: RSI shows
a bearish divergence, OBV does not. The volume-based measure says net buying has kept pace with the
advance, while the price-momentum measure says the rate of advance has slowed.
Bull Case vs Bear Case
Bull Case
- Full Close > SMA5 > SMA20 > SMA60 alignment, with SMA5 above SMA20 since August 7 (35 sessions).
- Mansfield RS +152.2% vs the Nasdaq Composite, accelerating: +3.26 points on the week, +32.13 on the month.
- Fresh 20-day-high breakout on September 24; close only 1.2% under the 52-week high.
- MACD golden cross on September 16, both lines well above zero.
- OBV in accumulation and rising in both frames, 39.31% above its MA20 on the 90-day chart, with no OBV divergence.
- ADX 56.1 confirms a persistent trend; price is far above the 90-day aVWAP ($8.20) and 2-year aVWAP ($3.62).
Bear Case
- RSI bearish divergence: $8.99 / RSI 83.15 on Aug 20 vs $11.00 / RSI 77.2 on Sep 25, with RSI at 74.4.
- The breakout came on below-average raw volume (0.89× and 0.92×); roughly 1.13× after market adjustment.
- The close sits inside an unfilled 2024 resistance gap ($10.80–$12.10), and at the upper Bollinger band ($11.26).
- Relative strength is heavily built on one session — the +43.1% move of August 6.
- Price is 18.3% above SMA20 and 59.5% above SMA60; ADX above 50 marks a mature, extended trend.
- ATR is 5.3% of price; the 2×ATR reference is 10.5% below the close.
Scenarios
| Scenario | Probability | Path | Trigger / Invalidation |
|---|---|---|---|
| Trend continues through the gap | 40% | Price clears the $11.13 52-week high and the $11.26 upper band and works through the 2024 gap toward its top at $12.10, with SMA5 continuing to track underneath. | Trigger: daily close above $11.13 on volume above the 13,732,205 20-day average. Invalidation: close below SMA5 $10.56. |
| Pause and digestion | 40% | The divergence resolves sideways: price consolidates between the 23.6% retracement at $10.33 and the $11.13 high while SMA20 ($9.30) rises toward price and RSI cools off the overbought zone. | Trigger: closes contained between $10.33 and $11.13. Invalidation: a decisive close outside either edge. |
| Deeper pullback | 20% | The divergence plays out as a real pullback: price loses the 23.6% level and the 2×ATR reference and retraces toward the 50% level at $9.57 and SMA20 at $9.30. | Trigger: close below the 2×ATR reference $9.84. Invalidation: recovery back above $10.56. |
Key Levels nearest to the close first, listed high to low
| Price | Role | Basis | Distance |
|---|---|---|---|
| $12.10 | Resistance | Top of the unfilled gap of November 8, 2024 ($10.80–$12.10) | +10.0% |
| $11.26 | Resistance | Upper Bollinger band | +2.4% |
| $11.13 | Resistance | 52-week high (intraday, September 25, 2026) | +1.2% |
| $11.00 | Current | Close of September 25, 2026 · 0% of the Fibonacci up-swing | — |
| $10.56 | Support | SMA5 | −4.0% |
| $10.33 | Support | 23.6% retracement of the $8.14 → $11.00 up-swing | −6.1% |
| $9.84 | 2×ATR stop | Objective invalidation reference, 2 × ATR $0.58 | −10.5% |
Below the stop reference, the 38.2% retracement sits at $9.91, the 50% at $9.57, SMA20 at $9.30 and the September 10 swing low at $8.14. The unfilled August 6 support gap between $4.55 and $5.63 lies roughly 50% below the close — context for the larger picture rather than a near-term level.
What to Watch
- Volume on any close above $11.13. The breakout so far has come on below-average raw volume; a close through the 52-week high on volume above 13,732,205 shares would be the first volume confirmation of the latest leg.
- The RSI divergence. Whether RSI can exceed its August 20 reading of 83.15, which would erase the divergence, or whether it rolls back below 70 while price stalls.
- SMA5 at $10.56. The short-term average has carried the trend since August 7; a close below it is the first sign the staircase is breaking.
- Behavior inside the $10.80–$12.10 gap. Old supply from late 2024; stalling here would be typical of gap resistance.
- Follow-through after the analyst action. On September 24 Goldman Sachs resumed coverage at Buy with a $15 price target, citing Q2 performance; that session rose +5.99% on 0.89× volume. Whether later sessions build on it is a question the chart will answer.
Conclusion
Past Analyses of This Stock same ticker · newest first
Other signals from this issue same publication date · 5 stocks
This analysis is an educational interpretation of chart data and is not investment advice. Probabilities and levels are subjective estimates; every investment decision, and its outcome, is your own responsibility. All figures are derived from closing-price data through September 25, 2026 and are not updated after publication.
Two Week Swing · twoweekswing.com · 4,600+ stocks screened weekly