Waystar Holding Corp.
$27.36 −32.19% from 52-week high ($40.35)
This analysis is based on closing-price data as of October 16, 2026. Whether you're researching how to buy Waystar Holding Corp. stock or you've just opened a brokerage account and are trying to time an entry, here are objective support levels and stop-loss references built from the RSI, MACD and ATR indicators.
Snapshot as of Oct 16, 2026 close
| Item | Value | Read |
|---|---|---|
| Close | $27.36 | −3.12% on the day after a +5.10% session |
| 52-week high / low | $40.35 / $17.26 | −32.19% from high · +58.52% from low |
| SMA5 / SMA20 / SMA60 | $27.08 / $25.95 / $24.97 | Bullish stack (Close > 5 > 20 > 60) |
| Bollinger (20) | $27.88 / $25.95 / $24.02 · width 14.89% | Close in the upper half, below the upper band |
| aVWAP 90d (anchor Jul 30, 2026) | $24.96 | Price above — short-term buyers in profit |
| aVWAP 2y (anchor Feb 17, 2026) | $23.23 | Price above — longer-term anchor well below |
| RSI (14) | 59.2 | Constructive, not overbought |
| Mansfield RS vs the Nasdaq Composite | −3.69% | Still underperforming, improving (+7.58 pts w/w) |
| MACD (12,26,9) | 0.618 / signal 0.457 / hist 0.161 | Golden cross Oct 6, above zero |
| ADX (14) | 24.8 (90d) · 24.3 (2y) | Emerging trend (20–25 band) |
| ATR (14) | $1.19 (4.34% of price) | Moderate daily range |
| OBV (2y / 90d) | +16.42% / +12.19% vs MA20 | Early accumulation on both, slope flat |
| Volume | 2,708,400 · 1.34x 20-day avg | Above average on a down day |
| 1×ATR / 2×ATR stop | $26.17 / $24.99 | 2×ATR = −8.67% from close |
① Price & Moving Averages
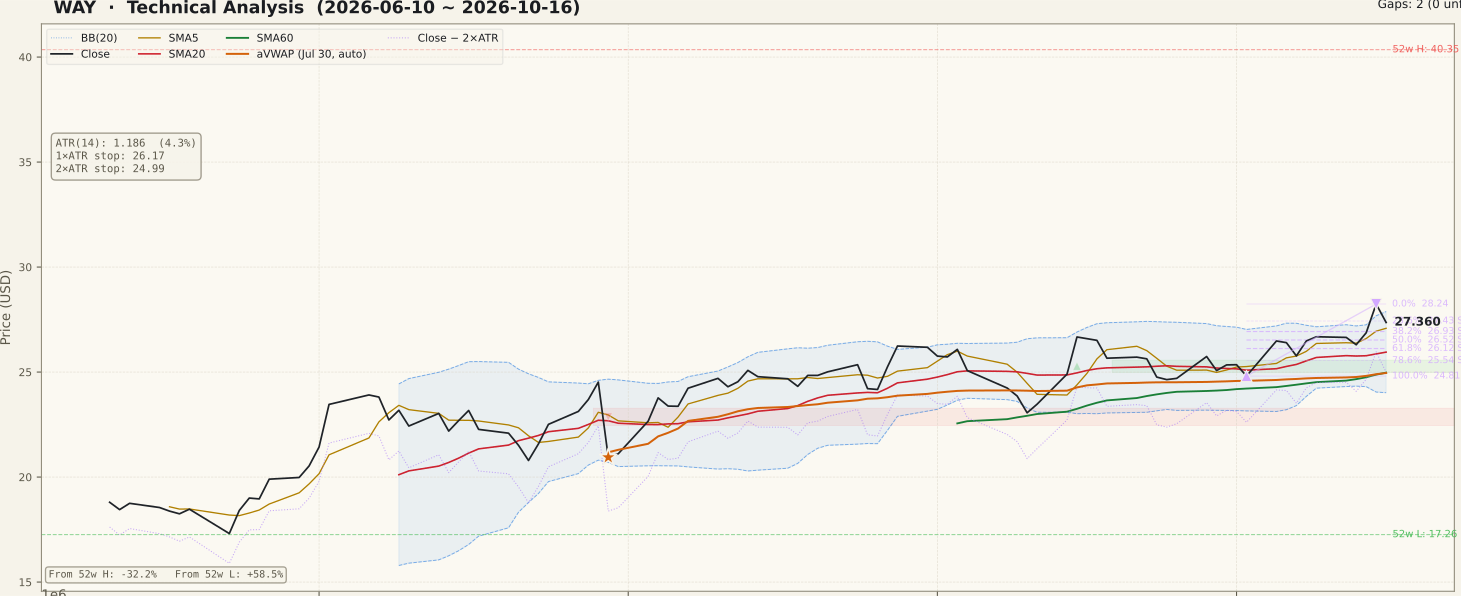
The two-year picture frames everything: a peak area in early 2025, a long range in the high $30s, then a decline from late 2025 into a $17.26 low on June 22, 2026. Since then price has stepped up in a stair-like pattern, and the SMA60 ($24.97) has turned from falling to rising underneath it. The close has held above the SMA60 continuously since July 1 — including through a −14.60% session on July 30 — which is the backbone of the setup.
The full bullish stack (SMA5 > SMA20 > SMA60) is a re-formation, not a first appearance: it first formed on July 15, broke and re-formed several times (late July, early August, September 9, September 24), and the current continuous run dates from October 1. The close has been above the SMA20 ($25.95) since October 5, after briefly slipping under it on October 2. Practically, the moving averages have been tightly braided, so a single soft week can undo the stack.
On October 15 WAY closed at $28.24, above the prior 20-session intraday high of $27.69 (set October 13). On October 16 it opened higher, reached $29.09 intraday, and closed at $27.36 — back below that $27.69 level. That long upper wick is the most important short-term detail on the chart: the breakout attempt has not yet been accepted on a closing basis. The 90-day Fibonacci swing (low $24.81 on Oct 2 to high $28.24 on Oct 15) puts the 23.6% level at $27.43 — just above the close — and the 38.2% at $26.93. Both gaps in the 90-day window have been filled.
② Volume

The final three sessions all traded above the 20-day average: roughly 1.9x on October 14 (+2.17%), 1.75x on October 15 (+5.10%) and 1.34x on October 16 (−3.12%, 2,708,400 shares vs a 2,025,445 average). Across a broad sample of U.S. stocks, median volume was running slightly below its own 20-day average on those days, so WAY's participation was moderately above the market, not extreme.
The pattern is mixed. Up days carried the heavier volume, which favors buyers, but the reversal day still drew 1.34x — sellers were present at the highs, not absent. For context, the 90-day window's heaviest sessions were July 30 (−14.60% on about 2.3x) and September 15 (+7.11% on about 2.5x, after a gap up that later filled); neither falls in the most recent week.
③ MACD

MACD is 0.618 against a signal of 0.457, with a positive histogram of 0.161; the last cross was a golden cross on October 6. Because both lines sit above zero, this is a momentum re-acceleration within an existing uptrend rather than an early bottoming cross.
The chart shape adds a caveat: MACD has whipsawed around its signal line repeatedly since August, and the current reading is still below the July momentum peak. The histogram expanded into October 15 and flattened on the reversal day. A fresh dead cross would be the first sign the October push is fading.
④ RSI

RSI(14) is 59.2. It has spent most of the past three months in the 45–65 band, holding above 50 on most pullbacks — typical of an orderly uptrend rather than a stretched one. The October 15 spike stayed below 70 and the reversal pulled it back toward 60.
No RSI divergence is flagged in the data. That means there is no bearish warning from RSI, but also no extra confirmation — the read is simply "room to move in either direction."
⑤ Mansfield RS vs the Nasdaq Composite

Mansfield RS vs the Nasdaq Composite is −3.69%, up from −11.27% a week earlier and −15.28% a month earlier — changes of +7.58 and +11.59 points. In the four-way frame that is negative and improving: WAY is still lagging the index on this measure, but closing the gap quickly.
The two-year panel shows how far this has come: RS fell to roughly −50 around June 2026 and has climbed steadily since. A move above zero would turn a recovery into genuine outperformance. Until then, the honest description is "less bad," and a negative RS is a reason to size more cautiously even with a bullish moving-average stack.
⑥ ATR · ADX

ATR(14) is $1.19, or 4.34% of price, and ticked up over the last three sessions as the daily range widened. That puts the 1×ATR reference at $26.17 and the 2×ATR reference at $24.99 — about 8.67% below the close.
ADX is 24.8 on the 90-day calculation (24.3 on the two-year), in the 20–25 "emerging trend" band and turning up from a long stretch near 20. Trend strength is building but not yet established; a push above 25 alongside price strength would confirm it.
⑦ OBV

OBV reads "early accumulation" on both timeframes: on the two-year calculation it sits 16.42% above its 20-day average, and on the 90-day calculation 12.19% above, with the slope flat in both cases. (These percentages are the gap between OBV and its own moving average, not a divergence measure.)
No OBV divergence is flagged. The two-year panel shows OBV recovering from negative territory in June to near its prior highs, which supports the idea that the rally since summer has had real participation. The flat slope, however, says that buying pressure has stopped expanding for now.
Bull vs Bear
Bull Case
- Bullish moving-average stack: $27.36 > SMA5 $27.08 > SMA20 $25.95 > SMA60 $24.97.
- Close has held above the SMA60 every session since July 1, and the SMA60 is now rising.
- MACD golden cross on Oct 6 with both lines above zero (hist 0.161).
- Mansfield RS improved +7.58 pts in a week and +11.59 pts in a month.
- OBV in early accumulation on both 2y and 90d, no divergence flagged.
- Support cluster: SMA60 $24.97, 90d aVWAP $24.96 and 2×ATR $24.99 sit within a few cents.
Bear Case
- Oct 16 reversal: high $29.09, close $27.36, back below the prior 20-session high of $27.69.
- Mansfield RS is still negative (−3.69%) — the stock has not yet outperformed the Nasdaq Composite.
- The MA stack is a re-formation that has broken four times since July.
- ADX 24.8 is only an emerging trend; MACD has whipsawed repeatedly since August.
- OBV slope is flat — buying pressure is not expanding.
- Price is still 32.19% below the 52-week high, with a long overhead history from the decline.
Scenarios
| Scenario | Probability | Path | Trigger / Invalidation |
|---|---|---|---|
| Consolidation above SMA20 | 45% | Price digests the Oct 15–16 swing between roughly $25.95 and $27.88, then retests $28.24. | Trigger: closes holding $26.93–$25.95. Invalidation: close below SMA20 $25.95. |
| Breakout continuation | 30% | A close back above $28.24, then through the $29.09 intraday high, with volume above average. | Trigger: close > $28.24 on >1x volume and RS crossing zero. Invalidation: another upper-wick rejection. |
| Failed breakout | 25% | The Oct 16 reversal extends, SMA20 gives way and price tests the $24.96–$24.99 cluster. | Trigger: close below $25.95. Invalidation of the setup: close below the 2×ATR stop $24.99. |
Key Levels
| Price | Role | Basis |
|---|---|---|
| $28.24 | Resistance | Oct 15 close · 90d Fibonacci 0% (swing high) |
| $27.88 | Resistance | Upper Bollinger Band |
| $27.36 | Current | Oct 16 close |
| $26.93 | Support | 90d Fibonacci 38.2% |
| $25.95 | Support | SMA20 / Bollinger midline |
| $24.99 | Stop (2×ATR) | 2×ATR stop · SMA60 $24.97 and 90d aVWAP $24.96 just below |
| $24.81 | Support | Oct 2 swing low · 90d Fibonacci 100% |
What to Watch
- Whether WAY can close back above $28.24 — and stay there — after the Oct 16 upper-wick rejection.
- Mansfield RS crossing above zero vs the Nasdaq Composite (currently −3.69%).
- Daily closes relative to the SMA20 ($25.95); a close below would break the current MA stack run.
- ADX moving above 25 with OBV slope turning up — both would confirm the trend is strengthening.
- The company's next quarterly report may fall within the coming weeks; check the date, since the 90-day window already contains a −14.60% single session (Jul 30).
Conclusion
Past Analyses of This Stock same ticker · newest first
Other signals from this issue same publication date · 6 stocks
This analysis is an educational interpretation of chart data and is not investment advice. Probabilities and levels are subjective estimates; every investment decision, and its outcome, is your own responsibility.
Two Week Swing · twoweekswing.com · 4,600+ stocks screened weekly