Freedom Holding Corp.
$181.57 −0.38% from 52-week high ($182.26)
This analysis is based on closing-price data as of October 16, 2026. Whether you're researching how to buy Freedom Holding Corp. stock or you've just opened a brokerage account and are trying to time an entry, here are objective support levels and stop-loss references built from the RSI, MACD and ATR indicators.
On the two-year chart FRHC has spent 2026 rebuilding from a February low near $107.97 (the 52-week low) into a series of higher lows, and the Oct 16 close of $181.57 is the highest close of the past year, just under the $182.26 52-week intraday high printed the same day. The short-term picture is a four-session climb on gradually rising volume that pushed price above its prior 20-day range and re-stacked the moving averages bullishly. The lens to keep on: this is a breakout out of a non-trending regime (ADX about 15), so it still has to prove it can turn into a trend rather than another swing inside a wide range.
Snapshot as of Oct 16, 2026 close · 90d JSON unless noted
| Metric | Value | Read |
|---|---|---|
| Close | $181.57 | Highest close of the past 52 weeks |
| 52-week high / low | $182.26 / $107.97 | −0.38% from high · +68.16% from low |
| SMA 5 / 20 / 60 | $175.65 / $173.06 / $164.04 | Close > 5 > 20 > 60 (bullish stack) |
| Bollinger (20) | $180.73 / $173.06 / $165.40 | Close above upper band · width 8.86% |
| aVWAP 90d (anchor Aug 20, 2026) | $169.85 | Price above short-term aVWAP |
| aVWAP 2y (anchor Nov 7, 2025) | $145.25 | Price well above long-term aVWAP |
| RSI (14) | 63.23 | Firm, not overbought · no divergence |
| Mansfield RS vs the Nasdaq Composite | +17.45 | Outperform, rising · +12.95 w/w · +14.11 m/m |
| MACD / Signal / Hist | 2.95 / 2.35 / +0.60 | Golden cross Oct 15, 2026 |
| ADX (14) | 14.96 | Ranging (below 20) |
| ATR (14) | $5.98 (3.29%) | Moderate daily range |
| OBV 2y / 90d | +11.43% / +22.18% vs MA20 | Early accumulation on both · slope flat |
| Volume | 153,200 (1.45× 20d avg) | Above average on the breakout day |
| 1× / 2× ATR stop | $175.59 / $169.61 | 2× ATR = −6.59% from close |
① Price & Moving Averages
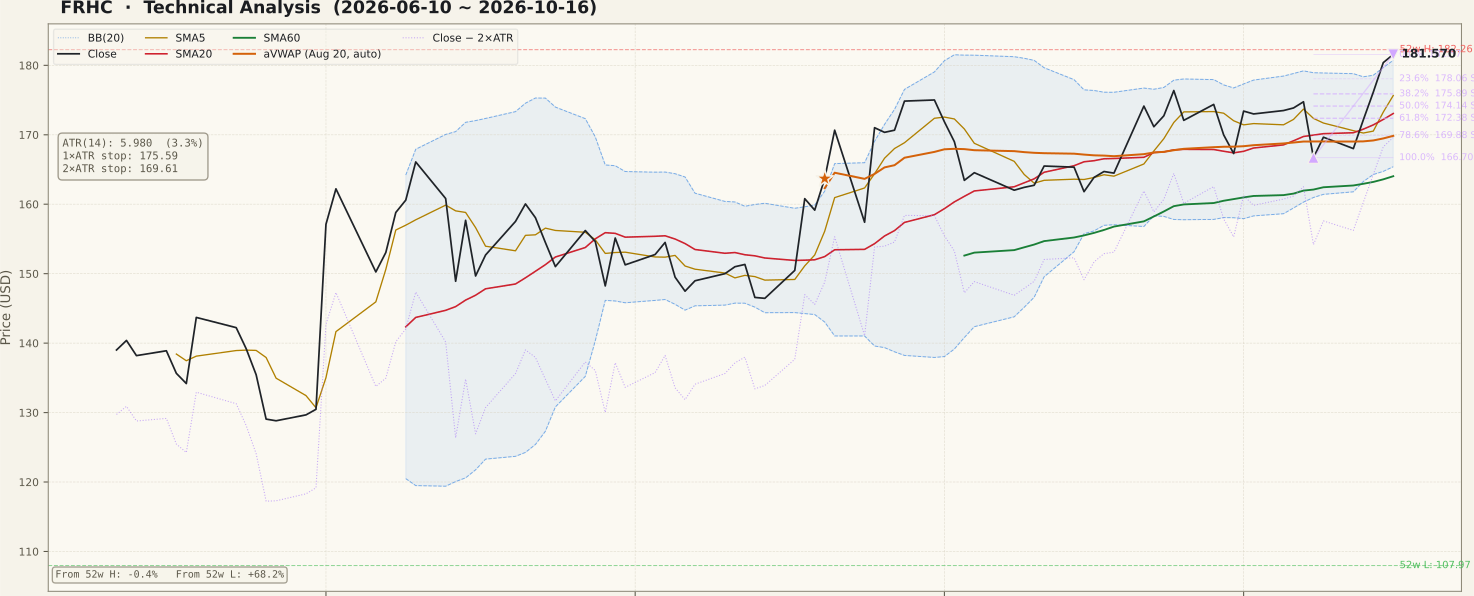
Price closed at $181.57, above the 5-day ($175.65), 20-day ($173.06) and 60-day ($164.04) averages, and the averages themselves sit in bullish order. That stack is not a single continuous run: SMA5 > SMA20 > SMA60 first formed in this leg on Aug 19, broke in early September, re-formed on Sep 22, broke again on Oct 13 after the Oct 8 drop pulled the 5-day under the 20-day, and re-formed on Oct 15. Close has held above the 60-day average continuously since Aug 17 and back above the 20-day since Oct 13.
The breakout itself: on both Oct 15 and Oct 16 the close finished above the highest intraday high of the prior 20 sessions (and therefore above the highest prior close as well), ending a range that had capped price since late August. The Oct 16 session also set the 52-week intraday high of $182.26. On the two-year chart, however, the 2025 peaks sit above today's price, so the stock is entering a zone where it traded heavily a year and more ago. The close also finished above the upper Bollinger band ($180.73) with a band width of 8.86% — expansion out of a fairly tight band, which often comes with a short pause or a test back toward the midline.
For context only: the current up-leg began with a roughly 20% one-day jump on Jul 1, 2026 from the late-June low (the 2y Fibonacci low anchor at $128.82, Jun 26) — a historical move well outside the last five sessions. The 2y swing's 0% anchor at $166.09 (Jul 10) is now below price. On the 90-day swing, the fresh up-swing runs from $166.70 (Oct 8) to $181.57 (Oct 16), giving pullback references at 23.6% $178.06, 38.2% $175.89, 50% $174.14 and 61.8% $172.38.
② Volume

Oct 16 volume was 153,200 shares, 1.45× the 20-day average of 105,810. The four-session climb (Oct 13 +2.46%, Oct 14 +2.32%, Oct 15 +2.41%, Oct 16 +0.65%) came with volume stepping up from below average to roughly 1.0×, 1.35× and 1.45× — participation that builds rather than spikes. During the same week the median stock in a broad market sample traded at roughly 0.76–0.94× its own average, so FRHC's volume was modestly above the market's pace, not just riding a busy tape.
This is confirmation of moderate strength, not a high-conviction volume surge. One unresolved print sits in the window: Oct 2 traded about 3.5× average volume with a long intraday range yet closed essentially flat (−0.2%). No cause for that session was identified, and it is noted here as an unexplained data point rather than a signal. Daily dollar volume of roughly $28 million on the breakout day is adequate liquidity for a mid-cap.
③ MACD

MACD (2.95) crossed back above its signal line (2.35) on Oct 15, and the histogram has turned positive at +0.60. The cross happens above the zero line, which reads as a resumption of an existing uptrend rather than an early bottoming signal. The caveat is that this line has whipsawed repeatedly in the last two months: a cross above on Oct 7 lasted only one session before the Oct 8 drop reversed it. A cross that holds for several sessions and lifts MACD toward its September highs would carry more weight than the cross alone.
④ RSI

RSI(14) is 63.23 — firmly in bullish territory but below the 70 overbought line, so the four-day climb has not stretched momentum to an extreme. Across the 90-day window RSI has oscillated between roughly the high 40s and mid 60s, consistent with the range-bound behavior the ADX also shows. No RSI divergence is flagged in the data, so there is no momentum warning against the new closing high at this point.
⑤ Mansfield Relative Strength

Mansfield RS vs the Nasdaq Composite is +17.45 and rising. A week earlier it was +4.50 and a month earlier +3.34, so the change is +12.95 over the week and +14.11 over the month — positive and accelerating. On the two-year panel RS spent most of late 2025 and the first half of 2026 below zero, crossed back above zero around August, and has now made a sharp jump to its highest reading in more than a year. That jump is large relative to the stock's own weekly gain, which suggests the benchmark's weakness that week contributed; relative strength measures outperformance, not absolute direction.
⑥ ATR · ADX

ATR(14) is $5.98, 3.29% of price — well down from the volatility spike of July, so daily swings have normalized. That sets the 1× ATR reference at $175.59 and the 2× ATR stop at $169.61. ADX is only 14.96, labeled ranging: the moving-average stack is bullish but there is not yet a strong directional trend behind it. Breakouts from low-ADX conditions can start new trends, but they also fail more often — a rising ADX through 20 over the coming sessions would be the confirmation to watch.
⑦ OBV

OBV is tagged early accumulation on both timeframes. On the 90-day view OBV (2,107,300) is 22.18% above its 20-day average; on the 2-year view it is 11.43% above, and the 2-year line has climbed to its highest level of the whole two-year window. Both slope tags read flat, so the accumulation is present but not yet accelerating. No OBV divergence is flagged in either timeframe — the volume flow is broadly confirming the price high rather than lagging it.
Bull vs Bear
Bull Case
- Highest close in 52 weeks at $181.57, closing above the prior 20-session intraday high two days running.
- Bullish SMA stack (Close > 5 > 20 > 60) re-formed on Oct 15; close above SMA60 continuously since Aug 17.
- MACD golden cross above zero on Oct 15 with a positive histogram.
- Mansfield RS +17.45 and accelerating (+12.95 in a week) vs the Nasdaq Composite.
- OBV in early accumulation on both 2y and 90d, with no OBV or RSI divergence.
- Volume rose through the four-day climb (to 1.45×) while the market median was below 1×.
Bear Case
- ADX 14.96 = no established trend; low-ADX breakouts fail more often.
- Price is within 0.38% of the 52-week high and below the 2025 peaks visible on the 2-year chart — overhead supply zone.
- Close sits above the upper Bollinger band, a stretched spot that often sees a pullback toward the midline.
- Volume confirmation is moderate (1.45×), not a decisive surge.
- The MACD signal has whipsawed repeatedly — the Oct 7 cross reversed after one session.
- The Oct 2 session (about 3.5× volume, flat close) remains unexplained.
Scenarios
| Scenario | Probability | Path | Trigger / Invalidation |
|---|---|---|---|
| Breakout extends | 40% | Price clears the $182.26 52-week high and ADX turns up through 20 as the move becomes a trend. | Trigger: closes above $182.26 on above-average volume. Invalidation: close back under $178.06 within a few sessions. |
| Pause and retest | 40% | A pullback from above the upper band into the $175.59–$173.06 zone (1× ATR / SMA20) that holds, keeping the SMA stack intact. | Trigger: lighter-volume dip that finds support above SMA20. Invalidation: daily close below $173.06. |
| Failed breakout | 20% | Price slips back into the late-summer range, losing SMA20 and the 90d aVWAP. | Trigger: close below $169.85 (90d aVWAP). Invalidation of the setup: $169.61 2× ATR stop. |
Key Levels
| Price | Role | Basis |
|---|---|---|
| $182.26 | Resistance | 52-week intraday high (Oct 16) |
| $181.57 | Current | Oct 16 close |
| $178.06 | Support | 90d Fibonacci 23.6% |
| $175.59 | Support | 1× ATR reference · near 90d Fib 38.2% ($175.89) |
| $173.06 | Support | SMA20 / Bollinger midline |
| $169.85 | Support | 90d aVWAP (anchor Aug 20, 2026) |
| $169.61 | Stop | 2× ATR stop (−6.59%) |
What to Watch
- Whether price can close above the $182.26 52-week high with volume above its 20-day average.
- ADX: a move up through 20 would signal the breakout is turning into a trend; staying near 15 keeps the range-trade interpretation alive.
- How a pullback behaves — a light-volume dip that holds $173.06 (SMA20) is constructive; a heavy-volume drop below it is not.
- Mansfield RS holding above +10 after the sharp one-week jump.
- OBV slope turning from flat to rising, which would upgrade the accumulation read.
Conclusion
Past Analyses of This Stock same ticker · newest first
Other signals from this issue same publication date · 6 stocks
This analysis is an educational interpretation of chart data and is not investment advice. Probabilities and levels are subjective estimates; every investment decision, and its outcome, is your own responsibility. A bottoming or breakout signal is not a buy signal on its own.
Two Week Swing · twoweekswing.com · 4,600+ stocks screened weekly