Allot Ltd.
$9.03 −24.2% from 52-week high · +47.5% from 52-week low
This analysis is based on closing-price data as of October 16, 2026. Whether you're researching how to buy Allot Ltd. stock or you've just opened a brokerage account and are trying to time an entry, here are objective support levels and stop-loss references built from the RSI, MACD and ATR indicators.
Snapshot as of Oct 16, 2026 close
| Item | Value | Read |
|---|---|---|
| Close | $9.03 | Pressing the upper Bollinger Band ($9.05) |
| 52-week high / low | $11.92 / $6.12 | −24.2% from high · +47.5% from low |
| SMA 5 / 20 / 60 | $8.85 / $8.50 / $7.98 | Bullish order: Close > 5 > 20 > 60 |
| Bollinger (20) | $9.05 / $8.50 / $7.95 | Width 12.92% · close at the upper band |
| aVWAP 90d (anchor Sep 14) | $8.60 | Price above |
| aVWAP 2y (anchor Feb 25) | $7.67 | Price above |
| RSI (14) | 65.0 | Firm, below the 70 overbought line |
| Mansfield RS vs the Nasdaq Composite | +0.73% | Just above zero · rising (−11.22% a week ago) |
| MACD (12,26,9) | 0.226 / signal 0.177 / hist 0.049 | Golden cross Oct 13, above zero |
| ADX (14) | 37.3 | Strong trend (strength, not direction) |
| ATR (14) | $0.39 (4.27%) | Wide daily range for the price level |
| OBV 2y / 90d | Early distribution (−22.58%) / Early distribution (−60.36%) | Both below MA20, flat slope |
| Volume vs 20d avg | 7.75x (4,498,000 vs 580,290) | Flat close · cause not identified |
| 1× / 2× ATR stop | $8.65 / $8.26 | 2× ATR = −8.5% from close |
① Price & Moving Averages
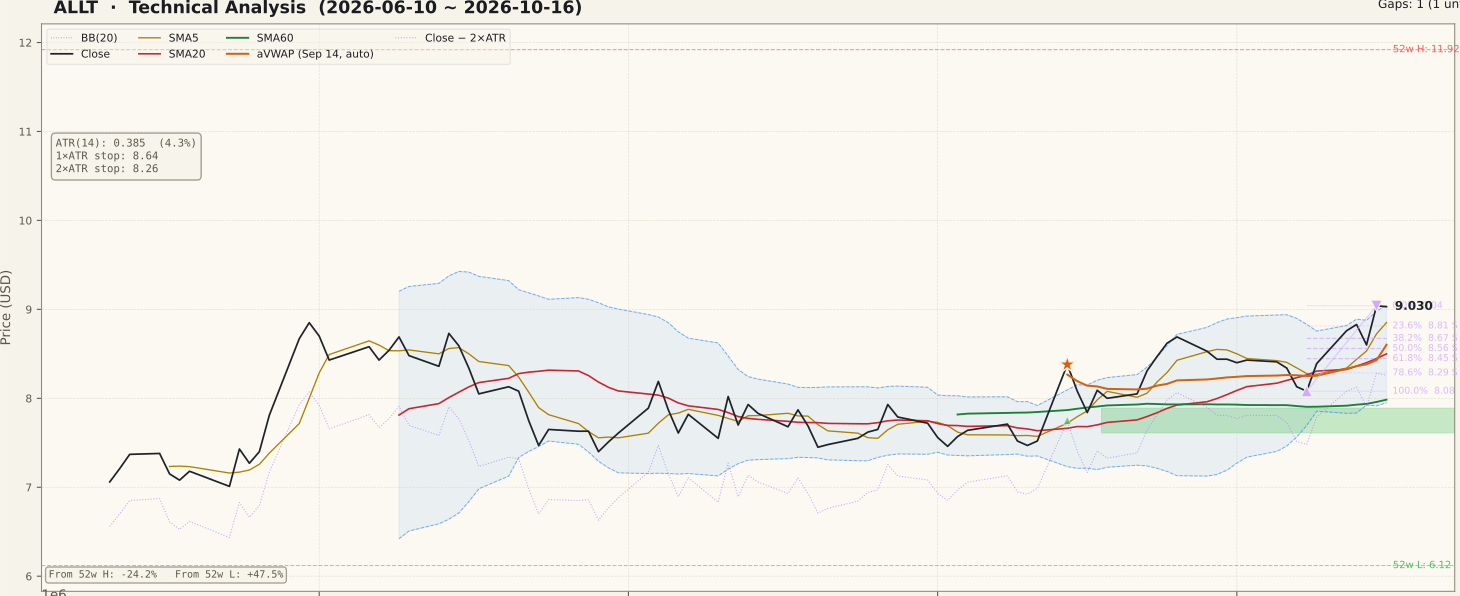
The bullish stack is young and has already been interrupted once. SMA5 > SMA20 > SMA60 first formed on September 28, held through October 8, broke on October 9 when SMA5 slipped under SMA20 during a pullback to about $8.08, and re-formed on October 12. The close has been above SMA20 since October 9 and above SMA60 since September 17.
The re-formation came on a +4.41% session on October 12, below the size the site normally treats as an event move, and no company announcement was found for that day. The October 15 close of $9.04 was the highest close since April, and Friday's $9.03 held almost exactly there. Closes above the prior 20-day high were last recorded on September 24 and 25; the latest closes sit just under the October 12 intraday high of $9.23.
On the two-year Fibonacci (the February 10 high of $10.43 to the February 27 low of $6.34), price has moved above the 61.8% level at $8.87; the next marked level is 78.6% at $9.55. One unfilled gap remains below, from September 14, between $7.61 and $7.89.
② Volume

Volume is the defining feature of this week. Measured against the 20-day average (including the same day), the five sessions ran about 3.3x (Oct 12, +4.41%), 1.6x (Oct 13, +0.80%), 1.7x (Oct 14, −2.60%), 2.5x (Oct 15, +5.12%) and 7.75x (Oct 16, −0.11%). The broad market was quiet that week, with median volume ratios across the screened universe of roughly 0.68–0.94x, so this activity is specific to ALLT.
The Friday print, 4,498,000 shares against a 580,290 average, came with a flat close. That combination says a lot of shares changed hands without a decisive winner on the day; it does not by itself say who was buying or selling. No company announcement was found for October 12 or October 16, and the cause of the Friday spike is not identified. Items in the public record include a TD Cowen Buy rating reported on October 13 and an annual shareholder meeting scheduled for October 22 (board, pay and auditor votes).
Earlier context: the September 14 session that opened the current leg rose 11.4% on roughly 4.9x volume and left the gap noted above.
③ MACD

MACD (0.226) crossed above its signal line (0.177) on October 13, and the cross happened above the zero line, which is a continuation signal rather than an early-recovery signal. The histogram is positive at 0.049 but still small. The previous MACD-above-signal stretch ended on October 6 during the early-October dip, so this is a re-cross after a short reset, not a first turn. A histogram that keeps widening over the next few sessions would confirm momentum; a quick flattening would suggest the burst of volume did not carry through.
④ RSI

RSI(14) is 65.0: strong, but not yet in overbought territory above 70. That leaves some room before the reading itself becomes a reason for caution. No RSI divergence is flagged in the data (the field is null), so there is no two-peak pattern to describe. On the two-year panel, RSI has spent most of 2026 between roughly 40 and 65, so a push through 70 would be new for this base.
⑤ Mansfield RS vs the Nasdaq Composite

Mansfield RS vs the Nasdaq Composite is +0.73%, up from −11.22% a week earlier and −14.81% a month earlier (+11.95 points on the week, +15.54 points on the month). That puts the stock in the positive and accelerating quadrant, but only just: it has been below zero since the February collapse, and one week of strength lifted it barely over the line. A reading this close to zero can slip back with a single weak week, so it is better treated as an improving trend than as established leadership.
⑥ ATR & ADX

ATR(14) is $0.39, or 4.27% of price, and has turned up with this week's wider bars. ADX at 37.3 marks a strong trend, but ADX measures strength, not direction, so it should be read alongside the moving-average order rather than as a bullish signal on its own. The ATR-based references are $8.65 (1× ATR) and $8.26 (2× ATR). The 2× level sits below SMA20 ($8.50) and the 90-day aVWAP ($8.60), so a move that deep would mean the structure built since mid-September had given way.
⑦ OBV

Both timeframes read early distribution: OBV is below its MA20 on the two-year (−22.58%) and 90-day (−60.36%) views, with a flat slope. This needs context. OBV counts a session's full volume as positive or negative based only on whether the close was up or down. Friday closed $0.01 below Thursday, so the entire 4.5 million-share session was counted as selling, and that single bar pulled OBV from above its average to well below it. The OBV panel shows the same thing as a sharp drop on the last bar.
That does not make the reading meaningless. Heavy turnover with no price progress is a fair reason for caution. But it is a one-bar artifact of a flat close, not a sustained pattern of distribution. The data flags no OBV divergence (the field is null); the panel caption's "bearish non-confirm" wording reflects that price is near its highs while OBV sits below its average, not a measured divergence.
Bull Case vs Bear Case
Bull Case
- Moving averages are in bullish order (Close > SMA5 > SMA20 > SMA60), re-formed on October 12.
- MACD golden cross on October 13, above the zero line.
- Mansfield RS vs the Nasdaq Composite turned positive (+0.73%), up nearly 12 points in a week.
- Price is above both anchored VWAPs: $8.60 (90-day) and $7.67 (2-year).
- ADX 37.3 marks a strong trend, and RSI 65.0 still sits below overbought.
- The October 15 close of $9.04 was the highest since April, near the top of a seven-month base.
Bear Case
- About 7.75x normal volume on Friday produced a flat close, and the cause is not identified.
- OBV is below its MA20 on both timeframes (early distribution), even if a single bar drives it.
- The bullish moving-average stack is only days old and already broke once (October 9).
- RS is barely above zero after seven months below it, so it can revert quickly.
- Price is pressing the upper Bollinger Band, with the $9.23 intraday high and the $9.55 Fibonacci level overhead.
- ATR at 4.27% of price means routine swings are wide; the 2× ATR reference is 8.5% below the close.
Scenarios
| Scenario | Probability | Path | Trigger / Invalidation |
|---|---|---|---|
| Breakout continuation | 40% | Clears $9.23, then works toward the $9.55 Fibonacci 78.6% level | Trigger: close above $9.23 with volume above average. Invalidation: close back under $8.81 |
| Digestion / pullback | 35% | Pulls back into the $8.50–$8.81 zone (SMA20, 90-day aVWAP, Fibonacci supports) and holds | Trigger: higher low above $8.50. Invalidation: close below $8.26 |
| Failed push | 25% | The heavy Friday session marks a short-term top; price slips back into the base | Trigger: close below SMA20 ($8.50), then the 2× ATR $8.26. The next support is the Sep 14 gap at $7.61–$7.89 |
Key Levels
| Price | Role | Basis |
|---|---|---|
| $9.55 | Resistance | 2-year Fibonacci 78.6% (Feb 10 high → Feb 27 low swing) |
| $9.23 | Resistance | October 12 intraday high |
| $9.04–$9.05 | Resistance | Upper Bollinger Band · Oct 15 close (90-day swing high) |
| $9.03 | Current | Oct 16 close |
| $8.81 | Support | 90-day Fibonacci 23.6% (Oct 8 low → Oct 15 high) |
| $8.50–$8.60 | Support | SMA20 $8.50 · 90-day aVWAP $8.60 · Fibonacci 50% $8.56 |
| $8.26 | Stop (2× ATR) | Close − 2× ATR · objective invalidation |
What to Watch
- Whether the next sessions close above $9.23 on above-average volume, or the Friday spike fades without follow-through.
- Whether OBV gets back above its MA20 after the one-bar drop. A recovery would undercut the distribution reading.
- Whether Mansfield RS holds above zero for a second week.
- The October 22 annual shareholder meeting, a scheduled event inside the next two weeks.
- Whether the stock holds the $8.50–$8.60 zone (SMA20 and 90-day aVWAP) on any pullback.
Conclusion
Past Analyses of This Stock same ticker · newest first
Other signals from this issue same publication date · 6 stocks
This analysis is an educational interpretation of chart data and is not investment advice. Probabilities and levels are subjective estimates; every investment decision, and its outcome, is your own responsibility.
Two Week Swing · twoweekswing.com · 4,600+ stocks screened weekly