U.S. Physical Therapy, Inc.
$81.24 −13.1% from the 52-week high
This analysis is based on closing-price data as of August 14, 2026. Whether you're researching how to buy U.S. Physical Therapy, Inc. stock or you've just opened a brokerage account and are trying to time an entry, here are objective support levels and stop-loss references built from the RSI, MACD and ATR indicators.
Over the two-year window USPH has spent most of its time under pressure, sliding from the $93.50 area of the 52-week high into a $59.00 low posted on May 7, 2026. What has happened since is a methodical repair: price has climbed +39.6% off that low, now sits above the SMA20 ($78.15) and the SMA60 ($70.38), and has fully erased the May down-swing on the fibonacci grid. The catch is that the confirmation layers have not kept pace — RSI has printed a lower high against a higher price high, OBV sits under its 20-day average on both timeframes, and Mansfield RS is still negative at −6.80%. The right lens here is a recovering but not yet market-leading name, with the burden of proof resting on the August 13 high of $82.76.
Snapshot values as of the Aug 14, 2026 close
| Metric | Value |
|---|---|
| Close | $81.24 |
| 52-week high / low | $93.50 / $58.19 (−13.1% from high · +39.6% from low) |
| SMA5 / SMA20 / SMA60 | $81.87 / $78.15 / $70.38 |
| Bollinger (20) | upper $84.18 · mid $78.15 · lower $72.12 (width 15.42%) |
| aVWAP — 2y anchor (Aug 7, 2025) | $77.02 |
| aVWAP — 90d anchor (May 7, 2026) | $69.21 |
| RSI(14) | 62.58 (2y) / 62.59 (90d) · bearish divergence flagged |
| Mansfield RS vs the S&P 500 | −6.80% · underperform, slope rising |
| MACD(12,26,9) | 2.73 / signal 2.61 / histogram +0.12 · golden cross Aug 10, 2026 |
| ADX(14) | 21.75 (2y) / 22.08 (90d) — emerging |
| ATR(14) | $3.23 (3.97% of price) |
| OBV | 2y: early distribution, below MA20, flat (−24.87%) · 90d: early distribution, below MA20, flat (−11.06%) |
| Volume | 364,100 vs 20-day average 259,970 (1.40x) |
| Stop references | 1×ATR $78.01 · 2×ATR $74.79 |
① Price & Moving Averages
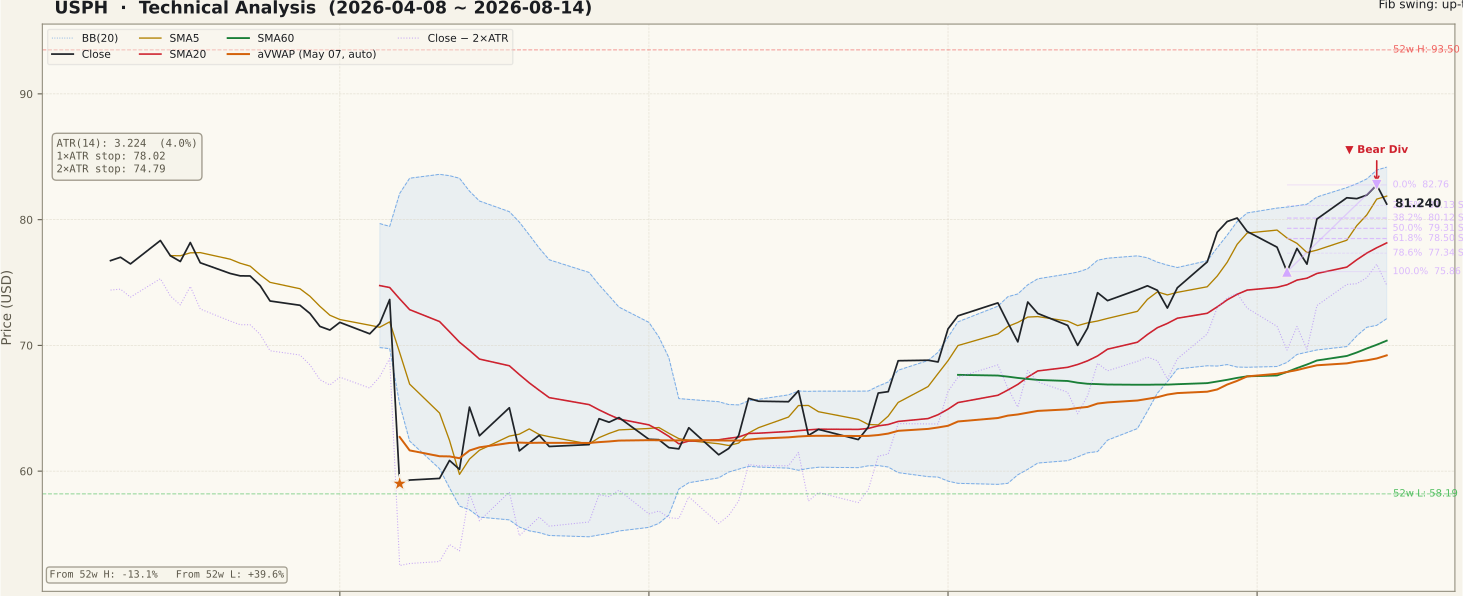
The moving-average stack reads constructive but not fully aligned: the close of $81.24 is above the SMA20 ($78.15) and the SMA60 ($70.38), and the SMA20 is comfortably above the SMA60, yet the close finished just under the SMA5 at $81.87. That single-day slip is the only crack in an otherwise textbook rising sequence. Bollinger width of 15.42% shows an expanded, not compressed, band, and the 90-day image shows price walking the upper half of the envelope for most of August — the shape of a live advance rather than a mean-reversion bounce. Both aVWAP anchors sit below price: the long-term anchor at $77.02 (Aug 7, 2025) and the short-term anchor at $69.21 (May 7, 2026), which means buyers from both windows are on average in profit and less likely to supply stock into strength. Overhead, the 2-year image shows a wide band of prior trading between here and the 52-week high of $93.50 that has turned back several attempts.
② Volume

The most recent session traded 364,100 shares against a 20-day average of 259,970 — a ratio of 1.40x. Elevated volume is normally a confirmation signal, but the 90-day image shows this particular expansion landing on a down candle, which makes it participation on the give-back rather than on the advance. A common beginner error is to treat any volume spike as bullish; the direction of the candle it attaches to is what gives it meaning. Through late July and early August the panel shows a fairly even mix of up-day and down-day volume with no single dominant accumulation cluster, consistent with a market that has repaired price faster than it has repaired conviction. For the advance to earn confirmation, an up day through the August 13 high of $82.76 would need volume at least at this same 1.4x level.
③ MACD

MACD sits at 2.73 against a signal line of 2.61, with a positive histogram of +0.12 and the most recent golden cross dated August 10, 2026. This is a fresh cross, but it is a fresh cross occurring far above the zero line rather than beneath it, which is the meaningful distinction: crossovers deep below zero mark the earliest phase of a turn, while crossovers at elevated levels sit inside a move that is already extended. The 90-day image shows the pair separating, briefly converging into a dead cross in early August, and then re-crossing — a hesitation rather than a clean break. The histogram is positive but thin, so the momentum edge here is directional in sign and modest in size.
④ RSI

RSI(14) reads 62.58 on the two-year frame and 62.59 on the 90-day frame — firmly in bullish territory but below the 70 overbought threshold. The chart flags a regular bearish divergence, and the peak data is specific: on July 9, 2026 price closed at $73.45 with RSI at 70.36; on August 13, 2026 price closed materially higher at $82.76 but RSI only reached 68.22. Price made the higher high; momentum did not follow. The honest reading is that this is a warning of possible exhaustion, not a confirmed top — a divergence can persist for weeks while price grinds higher, and it is only resolved when price itself reverses. Traders who short a divergence before price confirms are taking a position against a trend that remains intact on the price panel.
⑤ Mansfield RS

Mansfield RS vs the S&P 500 stands at −6.80% with a rising slope — below the zero line, so the stock is still lagging the index, but rising toward it. The trend in that number is the more useful part: a week ago the reading was −8.33 and a month ago −13.03, so the weekly change is +1.52 points and the monthly change is +6.22 points. In negative territory, an improving reading is correctly described as improving rather than accelerating — the stock is closing the gap on the index, not beating it. The 2-year panel shows how deep the hole was: RS spent most of the window between −10 and −30 and touched its lowest zone around the May low. Investors who screen on relative strength should note that this name has not yet crossed zero, and a negative RS reading is a legitimate reason to demand more confirmation from the other panels.
⑥ ATR & ADX

ATR(14) is $3.23, or 3.97% of the current price. That is a meaningful daily range: the entire distance from the close down to the SMA20 at $78.15 is under one ATR, so a single ordinary session can travel it without saying anything about the trend. Position sizing should be built from that number rather than from a fixed percentage. ADX reads 21.75 on the two-year frame and 22.08 on the 90-day frame, both inside the 20–25 emerging-trend band — a trend that has formed but has not yet reached the ADX > 25 threshold that marks a strong one. The 90-day image shows ADX drifting sideways in the low twenties for most of the summer while ATR climbed, a combination that describes widening daily ranges without a corresponding gain in directional conviction.
⑦ OBV

OBV is tagged early distribution on both timeframes, and both agree on the mechanism: OBV is below its own 20-day average with a flat slope. On the 90-day frame OBV is 1,013,500 against an MA20 of 1,139,510, a divergence of −11.06%. On the two-year frame OBV is −632,700 against an MA20 of −506,690, a divergence of −24.87% — the cumulative volume line has not recovered its two-year deficit even though price has recovered most of its. This is the clearest non-confirmation on the page: price is near the top of its 90-day range while the volume line has gone flat beneath its average. It does not invalidate the advance on its own, but a rally whose OBV refuses to make a matching high is a rally carrying less weight of committed buying than the price bars suggest.
Bull vs Bear
Bull Case
- Close of $81.24 sits above both the SMA20 ($78.15) and the SMA60 ($70.38), with the SMA20 above the SMA60 — a constructive medium-term sequence.
- MACD posted a golden cross on August 10, 2026 and the histogram is positive at +0.12, with both lines well above zero.
- Mansfield RS has improved from −13.03 a month ago to −6.80 — a +6.22-point move toward the zero line.
- Price is +39.6% above the 52-week low of $58.19 and has fully retraced the May down-swing, whose 100% level sits back at $73.65.
- Price trades above both aVWAP anchors — $77.02 (2y) and $69.21 (90d) — so average buyers in both windows are in profit.
- ADX in the 21.75–22.08 emerging band describes a trend that is forming rather than one already exhausted.
Bear Case
- Regular bearish RSI divergence: price rose from $73.45 (Jul 9) to $82.76 (Aug 13) while RSI fell from 70.36 to 68.22.
- OBV is below its 20-day average and flat on both frames — −11.06% (90d) and −24.87% (2y), tagged early distribution.
- Mansfield RS is still negative at −6.80%: despite the rally, the stock has lagged the S&P 500 over the measurement window.
- Price remains −13.1% below the 52-week high of $93.50, and the 2-year image shows repeated failed attempts in the band between here and that level.
- The close slipped back under the August 13 high ($82.76) and under the SMA5 ($81.87) on volume of 1.40x the 20-day average.
- ATR at 3.97% of price means one routine session can erase the entire cushion down to the SMA20.
Scenarios
| Scenario | Probability | Path | Trigger / Invalidation |
|---|---|---|---|
| Advance resumes toward the upper band | 45% | Holds the 23.6% retracement at $81.13, reclaims the SMA5 at $81.87, then presses the Aug 13 high of $82.76 toward the Bollinger upper band at $84.18. | Trigger: a close above $82.76 on volume above the 20-day average. Invalidation: a close back below the 50% retracement at $79.31. |
| Range consolidation while the divergence resolves | 35% | Chops between the SMA20 / Bollinger midline at $78.15 and the swing high at $82.76, letting RSI and OBV catch up to price without a decisive break. | Trigger: repeated closes inside the band with no expansion day. Invalidation: a close outside either edge of the range. |
| Divergence resolves lower | 20% | Loses the 78.6% retracement at $77.34, then the 100% level at $75.86, working toward the 2×ATR reference at $74.79. | Trigger: a close below $77.34. Invalidation: a reclaim of the 38.2% retracement at $80.12. |
Key Levels nearest to price first, descending
| Price | Role | Basis |
|---|---|---|
| $84.18 | Resistance | Bollinger upper band (20) |
| $82.76 | Resistance | August 13, 2026 swing high — 0% of the 90-day up-swing |
| $81.87 | Resistance | SMA5 — reclaimed or lost on a daily basis |
| $81.24 | Current close | Aug 14, 2026 close |
| $81.13 | Support | 23.6% retracement of the 90-day up-swing |
| $78.15 | Support | SMA20 and Bollinger midline (same level) |
| $74.79 | 2×ATR stop reference | Objective invalidation — 2 × $3.23 below the close (−7.9%) |
What to Watch
- Whether the August 13 high of $82.76 is taken out on above-average volume. Until it is, the RSI bearish divergence stays live.
- OBV crossing back above its 20-day average on the 90-day frame. The early-distribution tag is the single largest non-confirmation on this chart.
- Mansfield RS crossing zero. It has climbed from −13.03 to −6.80 in a month; above zero, the underperformance argument disappears.
- The SMA20 and Bollinger midline, both at $78.15 — the first structural level beneath price and less than one ATR away.
- ADX pushing above 25 from the current 21.75–22.08, which would move this from an emerging trend to a strong one.
Conclusion
Past Analyses of This Stock same ticker · newest first
Other signals from this issue same publication date · 7 stocks
This analysis is an educational interpretation of chart data and is not investment advice. Probabilities and levels are subjective estimates; every investment decision, and its outcome, is your own responsibility. Chart values are derived from closing-price data as of August 14, 2026 and will change with subsequent sessions.
Two Week Swing · twoweekswing.com · 4,600+ stocks screened weekly