Cleveland-Cliffs Inc.
$11.90 −28.7% from 52-week high
This analysis is based on closing-price data as of August 14, 2026. Whether you're researching how to buy Cleveland-Cliffs Inc. stock or you've just opened a brokerage account and are trying to time an entry, here are objective support levels and stop-loss references built from the RSI, MACD and ATR indicators.
Cleveland-Cliffs has spent two years in a wide, violent range between $7.73 and $16.70, and the current chapter began on July 23 when the stock gapped away from a $9.45 close and added 26.2% in two sessions on the heaviest volume of the year. That advance topped out at a $12.65 close on August 5 and has been leaking back ever since: four consecutive lower closes have brought price to $11.90, below SMA5 $12.24 but still above SMA20 $11.56, SMA60 $11.52 and the anchored VWAP of the gap session at $11.78. The distinguishing feature of the retreat is its silence — 8,776,900 shares on Friday against a 20-day average of 25,067,200 — which is the profile of a pullback rather than a rush for the exit. The honest counterweight is that Mansfield RS is still −7.59% against the S&P 500 and gave back ground last week, so this is a repair story inside a downtrend, not a leadership story.
Snapshot all values from the August 14, 2026 close
| Item | Value | Reading |
|---|---|---|
| Close | $11.90 | −28.7% from 52w high / +53.9% from 52w low |
| 52-week high / low | $16.70 / $7.73 | High printed Oct 20, 2025; low printed Mar 20, 2026 |
| SMA 5 / 20 / 60 | $12.24 / $11.56 / $11.52 | Close is above SMA20 and SMA60 but has slipped under SMA5 — a short-term pullback inside a recovering base |
| Bollinger (upper / mid / lower) | $13.76 / $11.56 / $9.36 | Price sits just above the mid band; width 38.04% — still wide after the July expansion |
| aVWAP (90d, anchored Jul 23, 2026) | $11.78 | Close is $0.12 above it — buyers from the gap session are marginally in profit |
| aVWAP (2y, anchored Feb 9, 2026) | $10.73 | Price above the long-term anchor by 10.9% |
| RSI (14) | 54.6 (90d frame 54.6) | Mid-range neutral, well clear of both 30 and 70 — but a bearish divergence is flagged |
| Mansfield RS (vs the S&P 500) | −7.59% | Below zero: underperforming. Up 17.5 pts on the month but down 3.19 pts on the week |
| MACD (12,26) | 0.43 / signal 0.39 / hist +0.03 | Golden cross dated Jul 21, both lines above zero — but the histogram is nearly flat |
| ADX (14) | 23.0 (90d frame 23.3) | Emerging — approaching but not yet at the 25 trend threshold |
| ATR (14) | $0.61 (5.12% of price) | High relative volatility — basis for stop sizing |
| OBV | 2y: early accumulation (+0.77% vs MA20, flat) / 90d: accumulation (+2.04%, rising) | Above its MA20 on both frames; the short frame is the stronger of the two |
| Volume vs 20-day avg | 0.35× (8,776,900 vs 25,067,200) | Quiet — roughly a third of normal participation on the down day |
| 1× / 2× ATR stop | $11.29 / $10.68 | Objective invalidation references |
① Price & Moving Averages
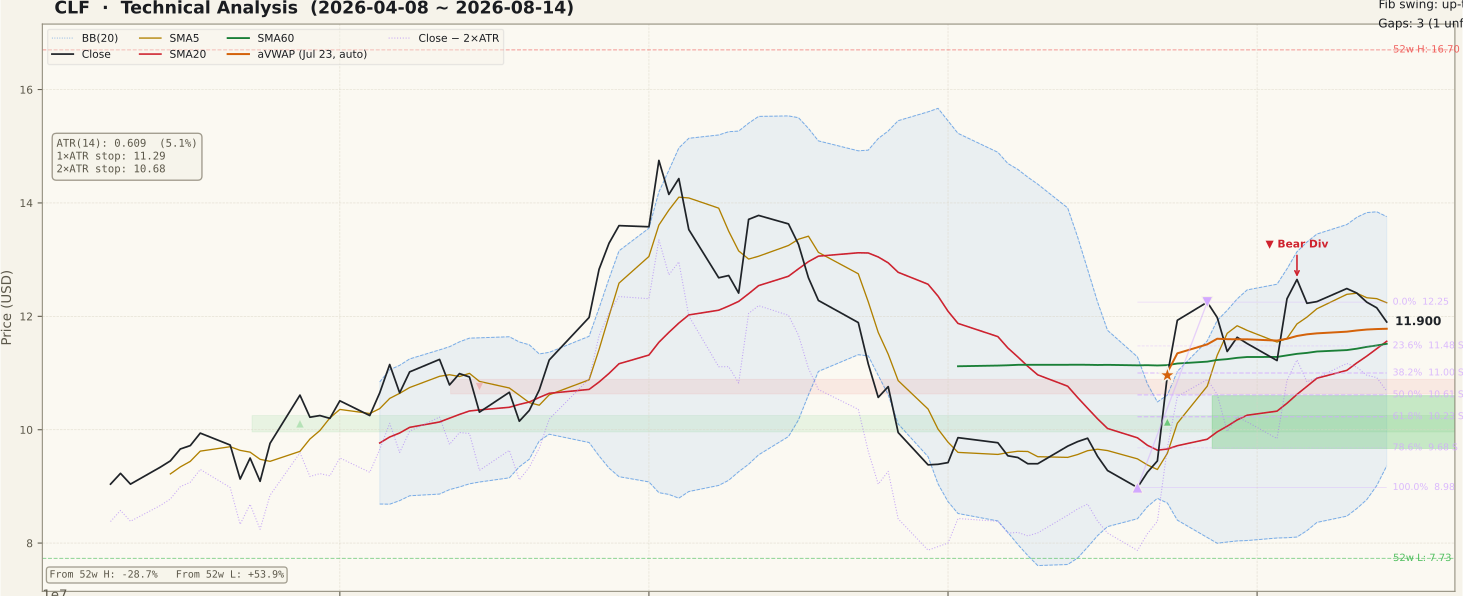
The two-year frame is a range, not a trend. Price topped at $16.70 on October 20, 2025, unwound through the winter, gapped down hard on February 9, 2026 — a session that opened at $13.10 against the previous close of $14.73 and is the reason the two-year anchored VWAP sits at $10.73 — and bottomed at $7.73 on March 20. A summer rally carried back to $13.78 on June 12 before collapsing to $9.38 by June 29, and it is that down swing the two-year Fibonacci grid measures: 23.6% at $10.42, 38.2% at $11.06, 50% at $11.58, 61.8% at $12.10, 78.6% at $12.84 and the 100% line back at $13.78. The current close of $11.90 sits between the 50% and 61.8% lines, which is the band where a rebound inside a down swing is normally decided. On the 90-day frame the structure is tighter and more constructive: the July 20 low of $8.98 to the July 27 high of $12.25 defines an up swing whose retracement supports are $11.48 (23.6%), $11.00 (38.2%) and $10.61 (50%). Price at $11.90 is above SMA20 $11.56 and SMA60 $11.52, above the 90-day anchored VWAP of $11.78, and below only SMA5 $12.24 — a shallow pullback so far, with the unfilled July 23 gap at $9.67–$10.60 as the deeper structural floor.
② Volume

Friday traded 8,776,900 shares against a 20-day average of 25,067,200, or 0.35× normal, and it is one of the smallest bars in the 90-day panel. Context makes that number meaningful rather than alarming: the two sessions that built this advance, July 23 and July 24, printed 67,422,000 and 69,875,800 shares respectively, by far the tallest bars on the chart, so the 20-day average is still carrying the weight of that surge and every subsequent session looks small against it. What matters for a pullback is who is doing the selling, and the answer here is almost nobody — the four down days since August 10 traded 11,003,700, 13,268,600, 8,524,100 and 8,776,900 shares, each below average and each smaller than the last. That is the textbook signature of supply drying up rather than distribution, and it is the mirror image of the common beginner error of trusting a breakout on below-average volume. The test cuts both ways, though: a recovery attempt also needs volume to mean anything, so an advance back toward $12.25 on 8–10 million shares would be no more convincing than this decline has been damaging. Liquidity itself is not a concern in this name at these turnover levels.
③ MACD

MACD reads 0.43 against a signal of 0.39, with a histogram of just +0.03, and the golden cross is dated July 21, 2026 — two sessions before the gap. Both lines are above zero, which is the constructive part, and the cross came from deep below zero at roughly −0.6, which is the kind of origin that usually accompanies a genuine trend change rather than noise. The problem is the present: a histogram of +0.03 means the two lines have converged to a hair's breadth of each other, so the momentum that drove the advance has fully drained even though price has only given back $0.75 from the August 5 close. The two-year panel is a useful corrective on scale — this indicator has swung between roughly +1.1 and −1.0 on this stock, so 0.43 is a mid-sized reading and crosses in both directions are frequent. What resolves the ambiguity is simple and mechanical: expanding green histogram bars would say the July 21 cross is still working, while a histogram that turns negative would mark a dead cross and put the whole July advance into the category of a completed counter-trend bounce.
④ RSI

RSI finished at 54.6 on the two-year frame and 54.6 on the 90-day frame — the middle of the range, with no reading to lean on in either direction. Both timeframes flag a bearish divergence, and the peaks are specific: July 27 at price $12.25 with RSI 66.74, then August 5 at a higher price of $12.65 with a lower RSI of 64.83. A higher price high on a lower momentum reading is the classic regular bearish setup, and in this case it has already been partially confirmed by four lower closes. It should still be held loosely rather than treated as a verdict — the two RSI readings are under two points apart, neither peak reached the 70 overbought line, and a divergence is a possibility of reversal rather than proof of one. The practical levels are 50 below, which has been the pivot for every 2026 swing in this name and now sits only 4.6 points under the current reading, and 70 above, which the July advance never managed to touch even at its most vertical.
⑤ Mansfield Relative Strength

Mansfield RS versus the S&P 500 reads −7.59%, tagged underperforming with a rising slope, and the two horizons disagree in a way worth spelling out. A month ago the line stood at −25.11, so the monthly change is +17.5 points — a large improvement, but improvement toward zero from deep negative territory, which is repair rather than leadership. A week ago it stood at −4.41, so the weekly change is −3.19 points: inside negative territory that is deterioration, not merely slowing, and it happened while the index held up. This is exactly where a beginner misreads the panel — a line that is climbing steeply off a trough still means the stock has lost ground to the market over the measured window, and the sign of the level matters more than the direction of the last few bars. The two-year panel shows the line has been above zero before, most recently for a long stretch through late 2025, so a cross back above zero is achievable rather than hypothetical. Until that cross happens, every bullish reading elsewhere on this page belongs to a stock that is still lagging its index.
⑥ ATR & ADX

ADX is 23.0 on the two-year frame and 23.3 on the 90-day frame, both tagged emerging — below the 25 line that marks a trend strong enough to lean on, but closer to it than at any point since the June decline. Remember that ADX measures intensity and not direction, so a rise from here would only confirm that something has resolved, not which way; on this chart the highest ADX readings of the past two years accompanied declines, not advances. ATR carries the more actionable information. At $0.61 it is 5.12% of the $11.90 close, which is high in absolute terms and means an ordinary session can travel more than sixty cents without saying anything at all. That sets the objective invalidation lines: 1×ATR at $11.29 and 2×ATR at $10.68, the latter 10.2% below the close and immediately above the top of the unfilled July 23 gap at $10.60. A stop placed inside $0.61 of the close — anywhere above $11.29 — will be removed by routine noise on a stock with this volatility profile, so the correct adjustment for a 5% ATR is a smaller position, not a tighter stop.
⑦ OBV (On-Balance Volume)

The two frames carry different tags and both should be read. On the 90-day frame OBV is tagged accumulation, sitting 2.04% above its 20-day average with a rising slope — the volume trace is still building even as price drifts, which is the constructive reading available on this chart today. On the two-year frame the tag softens to early accumulation, only 0.77% above its MA20 and with a flat slope, because the cumulative line is still working off the enormous distribution of the February and June declines and one gap cannot erase that. The charts also annotate an OBV bearish divergence, and the reason is visible in the 90-day panel: the OBV peak came in early August while price made its high on August 5, and the line has since eased back toward its average. Set against that is the mechanical fact that a four-day slide on a third of normal volume subtracts very little from a cumulative measure, which is why the slope has held. The cleanest confirmation over the next two weeks is unglamorous — the 90-day line staying above its MA20 and continuing to rise while price consolidates would say the pullback is being absorbed rather than sold into.
Bull Case vs Bear Case
Bull Case
- Close $11.90 holds above SMA20 $11.56 and SMA60 $11.52, and above both anchored VWAPs — $11.78 (Jul 23) and $10.73 (Feb 9) — so buyers from the gap session are still in profit.
- The pullback is quiet: 8,776,900 shares is 0.35× the 20-day average of 25,067,200, and each of the four down days traded below average.
- MACD golden cross dated Jul 21 is still intact with both lines above zero (0.43 versus 0.39), and it originated from roughly −0.6 rather than from a flat base.
- OBV is above its MA20 on both frames, and the 90-day frame is tagged accumulation with a rising slope (+2.04%).
- Mansfield RS has repaired 17.5 points on the month, from −25.11% to −7.59% against the S&P 500.
- Price is +53.9% above the March 20, 2026 low of $7.73, with an unfilled gap at $9.67–$10.60 as structure beneath, and ADX at 23.0/23.3 is tagged emerging.
Bear Case
- Mansfield RS is still −7.59% — below zero and therefore underperforming — and it lost 3.19 points on the week from −4.41, which is deterioration inside negative territory.
- A bearish RSI divergence is flagged on both frames: Jul 27 at price $12.25 with RSI 66.74 versus Aug 5 at a higher $12.65 with a lower RSI of 64.83.
- Four consecutive lower closes from $12.49 on Aug 10 have put price under SMA5 $12.24, the first of the averages to break.
- The advance stalled between the 50% ($11.58) and 61.8% ($12.10) retracements of the Jun 12–Jun 29 down swing — the standard band where counter-trend rebounds end.
- Price remains −28.7% below the Oct 20, 2025 high of $16.70, with the $12.84 (78.6%) and $13.78 (100%) lines as unworked overhead supply.
- MACD histogram has compressed to +0.03 and the two-year OBV slope is flat at only +0.77% over its MA20, with a bearish OBV divergence annotated on the chart.
Scenarios
| Scenario | Probability | Path | Trigger / Invalidation |
|---|---|---|---|
| Shallow pullback is absorbed | ~40% | Price stabilises in the $11.48–$11.78 band where the 90-day aVWAP, SMA20 $11.56, SMA60 $11.52 and the 23.6% retracement cluster, volume stays light, then works back toward SMA5 $12.24 and the $12.25 swing high. | Trigger: a daily close back above $12.25 on volume at or above 25,067,200. Invalidated by a daily close under $11.48. |
| Deeper retracement into the gap | ~35% | The $11.48–$11.78 band gives way and price works down through the 38.2% line at $11.00 and the 50% line at $10.61 toward the top of the unfilled July 23 gap at $10.60, with the 2×ATR line at $10.68 sitting inside that zone. | Trigger: a daily close below $11.48, particularly on volume returning toward average. A close under $10.68 voids the setup outright. |
| Momentum resumes above $12.65 | ~25% | The pullback ends where it is, price clears the August 5 high close of $12.65 and works into the 78.6% line at $12.84, with the June 12 high of $13.78 and the upper Bollinger Band at $13.76 as the next shelf. | Trigger: a daily close above $12.65 with the MACD histogram expanding and 90-day OBV still rising. Invalidated by a close under $11.48. |
Key Levels
| Price | Role | Basis |
|---|---|---|
| $12.25 | Resistance | July 27 swing high and the 0% anchor of the 90-day up swing; SMA5 $12.24 sits on the same line, and the August 5 close of $12.65 caps the zone |
| $12.10 | Resistance | Fibonacci 61.8% of the Jun 12–Jun 29 down swing ($13.78 to $9.38) — where the July rebound stalled |
| $11.90 | Current price | August 14, 2026 close |
| $11.78 | Support | 90-day anchored VWAP, anchored to the July 23 gap session — the average price paid by buyers since the move began |
| $11.56 | Support | SMA20 and Bollinger mid band; the 50% retracement at $11.58 and SMA60 at $11.52 sit in the same band |
| $11.48 | Support | Fibonacci 23.6% of the Jul 20–Jul 27 up swing; the 1×ATR stop of $11.29 sits immediately below |
| $10.68 | Stop-loss | 2×ATR stop — objective invalidation (−10.2% from the close), just above the top of the unfilled July 23 gap at $10.60 |
What to Watch
- The $11.48–$11.78 band: the 90-day aVWAP, SMA20, SMA60 and the 23.6% retracement all sit inside $0.30 of each other, so this narrow band is where the pullback either ends or turns into something larger.
- Volume on any recovery attempt: the advance was built on 67–70 million-share sessions, so a bounce on the current 8–10 million would not confirm anything; watch for turnover moving back toward the 25,067,200 average.
- Mansfield RS crossing zero: the line is at −7.59% and lost 3.19 points last week — until it clears zero, this is a stock repairing relative to the S&P 500, not leading it.
- The MACD histogram at +0.03: effectively flat, so the next few bars decide it — expansion keeps the July 21 golden cross alive, a turn negative marks a dead cross.
- The 90-day OBV slope: currently rising and 2.04% above its MA20; holding that while price consolidates would say the pullback is being absorbed, while a drop below the average would confirm the annotated bearish divergence.
Conclusion
Past Analyses of This Stock same ticker · newest first
Other signals from this issue same publication date · 7 stocks
This analysis is an educational interpretation of chart data and is not investment advice. Probabilities and levels are subjective estimates; every investment decision, and its outcome, is your own responsibility. Technical signals describe what the chart has done, not what the company will do — always weigh fundamentals and your own risk tolerance before acting.
Two Week Swing · twoweekswing.com · 4,600+ stocks screened weekly