Beta Technologies, Inc.
$24.86 −37.1% from the 52-week high · +85.1% from the 52-week low
This analysis is based on closing-price data as of August 14, 2026. Whether you're researching how to buy Beta Technologies, Inc. stock or you've just opened a brokerage account and are trying to time an entry, here are objective support levels and stop-loss references built from the RSI, MACD and ATR indicators.
BETA spent most of 2026 grinding lower after its debut, bottoming at $13.43 in late March and then building a long, flat base between roughly $16 and $19 through the middle of the year. That base broke in the first two weeks of August: price cleared the $19–20 shelf on expanding volume, the moving averages flipped into a full bullish stack, and Mansfield RS crossed above zero for the first time in the record shown. The chart is therefore a young breakout out of a long base — strong on momentum and participation, but only two weeks old, still $14.64 below the 52-week high, and now extended 19.3% above its own 20-day average. The lens below is trend confirmation versus extension risk.
Snapshot values as of the August 14, 2026 close
| Metric | Value | Read |
|---|---|---|
| Close | $24.86 | Down from the $26.24 close the prior session |
| 52-week high / low | $39.50 / $13.43 | −37.1% from the high, +85.1% from the low |
| SMA 5 / 20 / 60 | $24.65 / $20.84 / $18.30 | Full bullish stack — Close > 5 > 20 > 60 |
| Bollinger (20, 2) | Upper $26.62 · Mid $20.84 · Lower $15.06 | Width 55.46% — bands wide and expanding |
| aVWAP — 2y (anchor Feb 11, 2026) | $17.73 | Price 40.2% above the long-term anchor |
| aVWAP — 90d (anchor May 6, 2026) | $18.37 | Price 35.3% above the short-term anchor |
| RSI(14) | 67.50 (2y) / 67.52 (90d) | Just under the 70 overbought line |
| Mansfield RS vs the S&P 500 | +6.69% | Outperform, rising — prior week +1.43, prior month −21.18 |
| MACD (12,26,9) | 1.95 / signal 1.44 / hist +0.52 | Golden cross on Aug 3, 2026; histogram positive |
| ADX(14) | 26.88 (2y) / 27.22 (90d) | Strong trend reading, up from sub-20 chop |
| ATR(14) | $1.73 (6.97% of price) | High volatility — position sizing matters |
| OBV | 2y: +243.52% vs MA20 · 90d: +47.89% vs MA20 | Accumulation, rising on both timeframes |
| Volume (last / 20d avg) | 3,435,300 / 1,769,250 | 1.94× average — heaviest of the advance |
| Stop references | 1×ATR $23.13 · 2×ATR $21.39 | 2×ATR sits 13.9% below the close |
① Price & Moving Averages
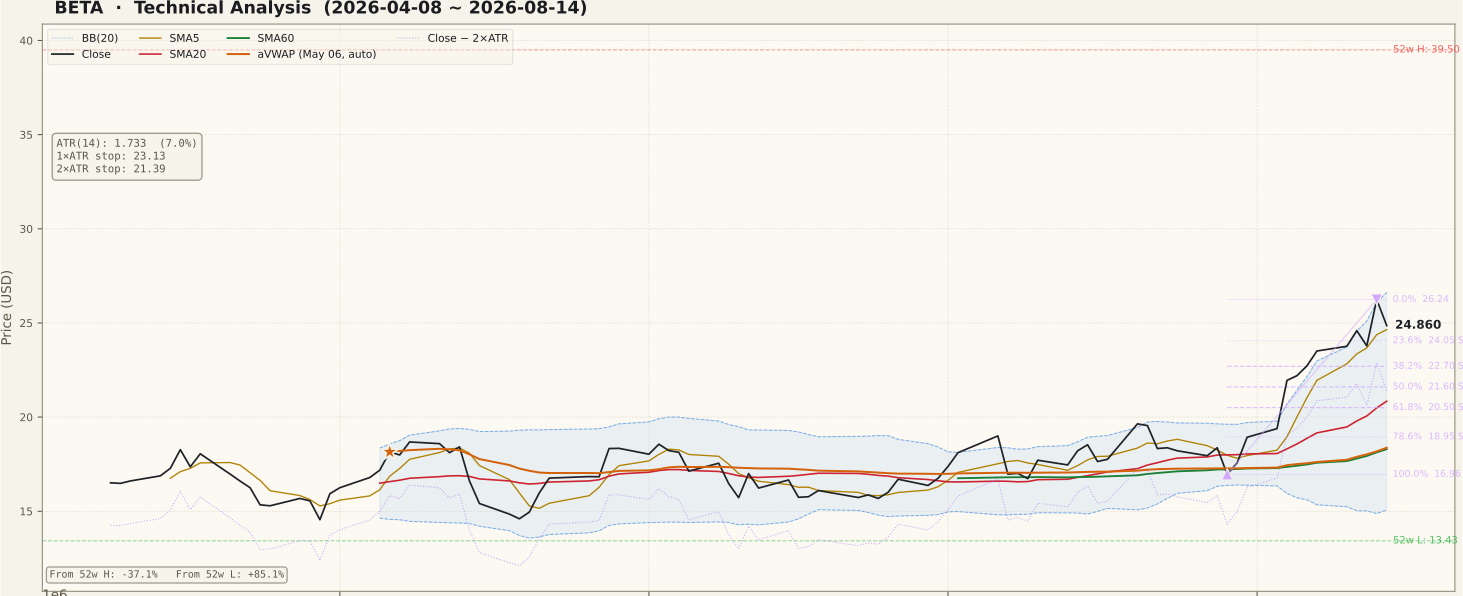
The moving averages are in a textbook bullish stack: close $24.86 > SMA5 $24.65 > SMA20 $20.84 > SMA60 $18.30, with all three curves turning up together. That alignment only appeared in August — for the three months before it, the 20- and 60-day lines were flat and braided together between $16.50 and $18, which is what a base looks like on a chart. The Bollinger structure tells the same story from the volatility side: width has expanded to 55.46% with price riding near the upper band at $26.62, the classic band-walk signature of a trend that has just started rather than one that is ending. Both anchored VWAPs sit far below — $17.73 from the February 11 anchor and $18.37 from the May 6 anchor — so essentially every buyer anchored to those dates is in profit, which removes a layer of supply. The caution is arithmetic, not sentiment: at 19.3% above the 20-day line and 35.9% above the 60-day, price has stretched well beyond its own averages, and a snap back to the Bollinger midline at $20.84 would be a 16.2% move without breaking the trend.
② Volume

The August advance has been carried by volume rather than drifting on air. The last session traded 3,435,300 shares against a 20-day average of 1,769,250 — a ratio of 1.94× — and the 90-day panel shows a cluster of above-average bars stacked through the second week of August rather than a single isolated spike. That matters because the most common beginner error at a breakout is accepting a price move that volume never confirmed; here the confirmation is present, and the July base itself was built on quiet, below-average turnover, which is the sequence a healthy base-to-breakout transition usually shows. The honest counterweight is the shape of that heaviest bar: the 1.94× day was a session that finished below the prior close, so the biggest print of the entire run came on a down candle. One such bar is not distribution, but a second and third heavy down day would change the reading materially.
③ MACD

MACD turned with a golden cross on August 3, 2026, and the momentum reading has expanded hard since: MACD 1.95 against a signal line of 1.44, leaving a histogram of +0.52 that has printed green and rising for the whole run. Both the MACD line and the histogram are at the highest levels visible anywhere in the two-year panel, including the post-listing period of late 2025 — momentum here is not merely positive, it is unprecedented within this stock's short record. Crossing from below zero, as this one did, is generally the earlier and more durable kind of cross, and the wide gap between the two lines confirms the move has acceleration behind it rather than drift. The flip side of a reading this extended is that the gap has to close eventually: the first sign of cooling would be a histogram that shrinks for three or four consecutive sessions while price holds, which typically precedes a pause rather than a reversal.
④ RSI

RSI(14) reads 67.50 on the two-year frame and 67.52 on the 90-day frame — the two agree, and both sit just beneath the 70 line after briefly poking above it earlier in the week. No divergence is flagged in the data, and no divergence peaks are recorded, so there is nothing here to call a top with; the panel simply shows momentum lifting out of the 45–55 band it occupied all through June and July. A frequent misreading is to treat RSI above 70 as a sell signal on its own — in a young trend out of a long base, RSI commonly parks in the 60s and 70s for weeks, and the March low near 25 on this same chart is the reminder that the indicator is a momentum gauge, not a timing trigger. The more useful observation is what the March oversold episode led to: RSI climbed out of the sub-30 zone and price took four months to build the base that is only now resolving.
⑤ Mansfield RS

Mansfield RS versus the S&P 500 stands at +6.69%, in outperform territory with a rising slope — and the change is the story. A week ago the same reading was +1.43, a month ago it was −21.18, so the weekly change is +5.27 and the monthly change is +27.87. Because the current value sits above zero and both changes are positive, this is positive and accelerating relative strength: the stock is beating the index and beating it by a widening margin. The panel makes the transition visually obvious — RS spent the entire visible history in the red underperformance zone before crossing the zero line in the last few sessions. The qualifier is the youth of that crossing: an RS record measured in days, not months, is the thinnest kind of outperformance evidence, and a stock that was 21 points behind the index four weeks ago has not yet demonstrated it can stay in front.
⑥ ATR & ADX

ADX reads 26.88 on the two-year frame and 27.22 on the 90-day frame, both above the 25 threshold that marks a strong trend, and the 90-day panel shows the line vaulting from the low 20s in a matter of days. ADX measures the strength of a move and not its direction, but paired with the bullish moving-average stack the direction is not in doubt here. ATR(14) is $1.73, which is 6.97% of the share price — a genuinely volatile instrument where a 7% daily range is normal rather than exceptional, and the 90-day ATR panel shows that figure rising sharply off the June and July lows as the base broke. The practical consequence is position sizing: a stop placed at 2×ATR sits at $21.39, fully 13.9% below the close, so a position sized as if this were a 2% -risk stock would be carrying several times the intended exposure. Tightening the stop instead of shrinking the position is the trap — at this ATR, a 5% stop would be inside a single day's normal noise.
⑦ OBV

On-balance volume is tagged accumulation on both timeframes, above its 20-day average and rising in each — the two frames agree, which is not always the case. The magnitude differs by design: on the 90-day frame OBV sits 47.89% above its MA20, while on the two-year frame the divergence is 243.52%, reflecting how far the cumulative line has travelled from a much lower base. The two-year panel is the more informative of the pair: OBV spent February through July below its moving average in the shaded distribution zone, then crossed above it in early August and has climbed almost vertically since. That is the sequence bulls want to see — accumulation showing up in the cumulative volume line at the same time price clears the base, rather than price making new highs while OBV lags, which is the classic non-confirmation. What is not yet established is durability: a cumulative line this steep flattens on the first quiet week, and the test will be whether OBV holds above its MA20 through a pullback rather than during the advance.
Bull Case vs Bear Case
Bull Case
- Full bullish stack — close $24.86 > SMA5 $24.65 > SMA20 $20.84 > SMA60 $18.30, all rising together.
- MACD golden cross on Aug 3 from below zero, now 1.95 vs signal 1.44 with a +0.52 histogram — the highest momentum reading in the record shown.
- Mansfield RS crossed above zero to +6.69% from −21.18 a month ago: positive and accelerating versus the S&P 500.
- OBV accumulation on both frames — 90d +47.89% and 2y +243.52% above MA20, both rising.
- Price is above both anchored VWAPs ($17.73 from Feb 11, $18.37 from May 6), so anchored buyers are not underwater.
- Breakout confirmed by turnover: 3,435,300 shares at 1.94× the 20-day average, with ADX up to 27.2 from sub-20 chop.
Bear Case
- Still 37.1% below the 52-week high of $39.50 — the entire November-to-January range overhead is unrecovered supply.
- Extended: 19.3% above SMA20 and 35.9% above SMA60; a reversion to the Bollinger midline at $20.84 is a 16.2% move.
- ATR is 6.97% of price, so an objective 2×ATR stop sits 13.9% away — the volatility cost of participating is high.
- The heaviest volume bar of the entire advance (1.94× average) printed on a session that closed below the prior close.
- RSI at 67.5 after a run of this speed leaves little room before the overbought band, and Bollinger width at 55.46% is already expanded.
- The relative-strength record is days old, and the price history itself begins in November 2025 — there is no multi-year structure to lean on.
Scenarios
| Scenario | Probability | Path | Trigger / Invalidation |
|---|---|---|---|
| Trend continuation | 45% | Shallow pause holds the 23.6% retracement at $24.05, then price retakes the $26.24 swing high and works the upper Bollinger Band at $26.62. | Trigger: close above $26.24 on at-or-above-average volume. Invalidation: close back below $22.70. |
| Sideways digestion | 35% | Price ranges between roughly $22.70 and $26.24 for two to three weeks while SMA20 climbs toward the price and the extension unwinds through time rather than depth. | Trigger: RSI cooling into the 50s while $22.70 holds. Invalidation: a decisive close outside either edge of the range. |
| Failed breakout | 20% | $24.05 and $22.70 give way, sending price toward the 50% retracement at $21.60 and the $20.84 Bollinger midline / SMA20 confluence. | Trigger: close below $22.70 on heavy volume. Invalidation: reclaiming $24.05 and holding it. |
Key Levels
| Price | Role | Basis |
|---|---|---|
| $26.62 | Resistance | Upper Bollinger Band (20, 2) — 7.1% above the close |
| $26.24 | Resistance | Aug 13 swing high; 0% of the current up-swing — 5.6% above the close |
| $24.86 | Current | Aug 14, 2026 close |
| $24.65 | Support | SMA5 — the first line the advance has to hold |
| $24.05 | Support | 23.6% retracement of the Jul 29 – Aug 13 swing |
| $22.70 | Support | 38.2% retracement — the shallow-pullback boundary |
| $21.39 | 2×ATR stop | Objective invalidation, 13.9% below the close (ATR $1.73) |
What to Watch
- Whether $24.05 (23.6% retracement) holds on the first pullback — a shallow retracement keeps the breakout intact; a slide straight through to $22.70 says the move ran ahead of demand.
- The volume signature of down days: another session at or above 1.9× average that closes lower would turn the single heavy down bar into a pattern.
- Whether Mansfield RS stays above zero. A drop back under the line within a few weeks would mark the crossing as a spike rather than a regime change.
- Whether OBV holds above its 20-day average during a price pause, not just during the advance — that is where accumulation claims get tested.
- SMA20 at $20.84 rising toward price. If the average catches up while price ranges, the 19.3% extension resolves without a drawdown.
Conclusion
Past Analyses of This Stock same ticker · newest first
Other signals from this issue same publication date · 7 stocks
This analysis is an educational interpretation of chart data and is not investment advice. Probabilities and levels are subjective estimates; every investment decision, and its outcome, is your own responsibility. All figures are derived from closing-price data through August 14, 2026.
Two Week Swing · twoweekswing.com · 4,600+ stocks screened weekly