Aveanna Healthcare Holdings Inc.
$12.32 −1.60% from the 52-week high of $12.52
This analysis is based on closing-price data as of August 14, 2026. Whether you're researching how to buy Aveanna Healthcare Holdings Inc. stock or you've just opened a brokerage account and are trying to time an entry, here are objective support levels and stop-loss references built from the RSI, MACD and ATR indicators.
For most of the past two years AVAH ground higher in a slow, low-volatility base, and as recently as August 12 it was still trading at $9.05 — inside the same range it had occupied all summer. Then, over the two sessions of August 13 and 14, the stock gapped away from that range and closed the week at $12.32, within 1.60% of its 52-week high of $12.52, on volume 2.85× the 20-day average. Every trend gauge on the page is now bullish — full moving-average stack, MACD golden cross, Mansfield RS at +33.68 versus the Nasdaq Composite — but all of it was produced by a two-session event rather than by an established advance, and the same two sessions left price above its upper Bollinger band with RSI at 77.47. The lens for this page is therefore not "is the trend up" but "how much of this move is structure and how much is a single unconfirmed catalyst."
Snapshot values as of the August 14, 2026 close
| Item | Value | Read |
|---|---|---|
| Close | $12.32 | Highest close of the 2-year window |
| 52-week high / low | $12.52 / $5.93 | −1.60% from high · +107.76% from low |
| SMA 5 / 20 / 60 | $10.21 / $9.70 / $8.62 | Close > 5 > 20 > 60 — full bullish stack |
| Bollinger upper / mid / lower | $11.26 / $9.70 / $8.14 | Close is above the upper band · width 32.16% |
| aVWAP (2y, anchor 2025-08-07) | $8.24 | Price far above the long-term anchor |
| aVWAP (90d, anchor 2026-05-14) | $8.82 | Price far above the short-term anchor |
| RSI (14) | 77.47 | Overbought · bearish divergence flagged |
| Mansfield RS vs Nasdaq Composite | +33.68 | Outperform, rising (1w ago 3.57 · 1m ago 14.27) |
| MACD / signal / histogram | 0.4268 / 0.2523 / +0.1745 | Golden cross on 2026-08-13, above zero |
| ADX | 24.41 | Emerging — below the 25 confirmation line |
| ATR (14) | $0.58 (4.685% of price) | High-volatility name; size positions accordingly |
| OBV (2y / 90d) | +22.14% / +38.92% vs MA20 | Early accumulation, above MA20, slope flat on both |
| Volume vs 20-day average | 7,333,000 / 2,574,455 = 2.85× | Move is participation-backed |
| 1× / 2× ATR stop reference | $11.74 / $11.17 | 2×ATR sits 9.37% below the close |
① Price & Moving Averages
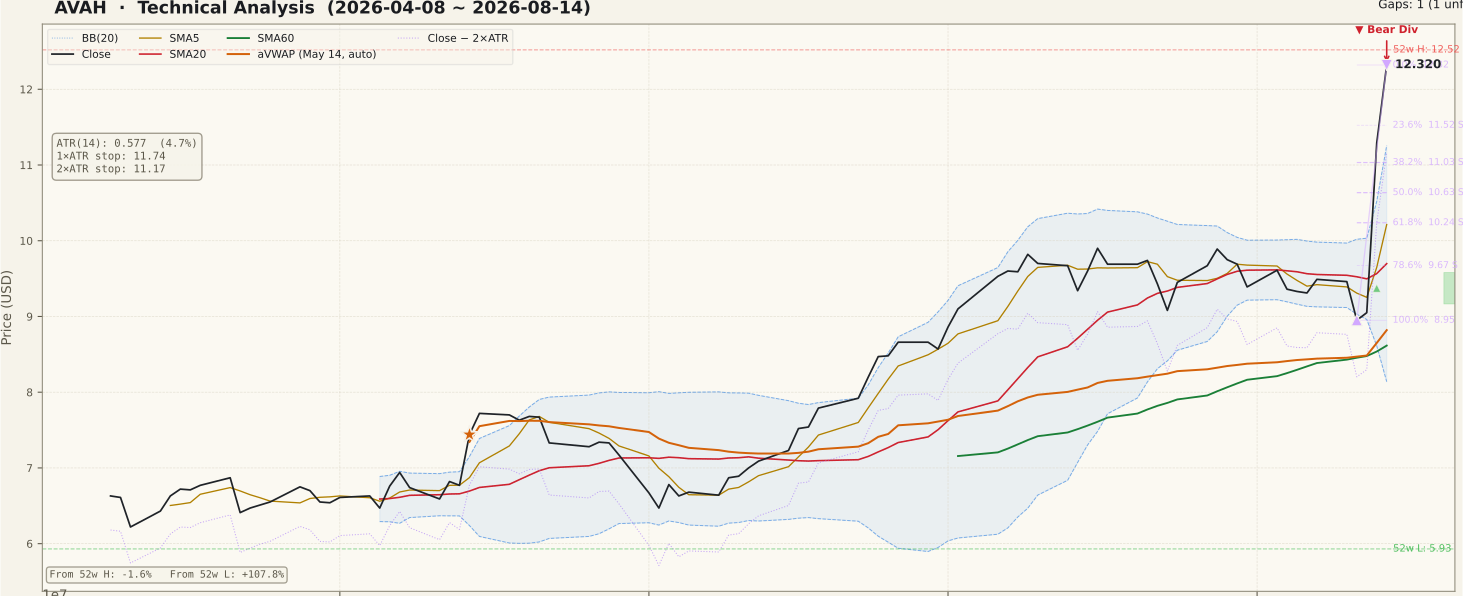
The moving-average structure is textbook bullish on paper: close $12.32 above SMA5 $10.21, above SMA20 $9.70, above SMA60 $8.62. What the 90-day panel makes obvious is how that stack was achieved — not by the averages turning up under a rising price, but by price vaulting over averages that are still lying flat where the summer range left them. The distance from close to SMA20 is roughly a quarter of the share price, which is the visual definition of an extended market.
Bollinger bands frame the same fact numerically. The upper band sits at $11.26 and the close is $1.06 above it, with band width already expanded to 32.16%. Trading outside the band is not a sell signal on its own — strong trends band-walk for weeks — but it does mean the statistical envelope has to widen or price has to come back before the two are in agreement again. Both anchored VWAPs sit far below at $8.24 (2-year anchor, 2025-08-07) and $8.82 (90-day anchor, 2026-05-14); every buyer from those anchors forward is in profit, which removes trapped-supply pressure but also creates a large pool of holders with unrealized gains to defend. The 23.6% retracement of the current swing at $11.52 is the first structural line under price.
② Volume

Volume is the strongest single item on this page. The August 14 session traded 7,333,000 shares against a 20-day average of 2,574,455 — a ratio of 2.85× — and the panel shows the preceding session was larger still. A common beginner error is to treat a breakout as valid without checking the volume behind it; that particular trap does not apply here. Participation unambiguously confirmed the move.
The caution is a different one. Volume of this magnitude, arriving in a two-day cluster after months of sub-3M sessions, is the signature of an event rather than of accumulation. Event volume confirms that something happened; it does not tell you whether the buyers are strategic holders or fast money that will be gone in a fortnight. The honest reading is that the breakout is confirmed and that the quality of the demand behind it will only be visible in how volume behaves as price consolidates over the next several sessions.
③ MACD

MACD printed a golden cross on August 13, 2026, with the MACD line at 0.4268 over a signal line at 0.2523 and a histogram of +0.1745. Both lines are above zero, which distinguishes this from the weaker class of cross that occurs deep in negative territory during a downtrend pause.
The timing is worth stating plainly: the cross and the price event are the same event, one day apart. MACD is a lagging construction built from moving averages, so a large single-session advance mechanically produces a cross regardless of what the prior trend was doing. That does not invalidate the signal, but it does mean MACD is currently echoing the price move rather than independently corroborating it. The histogram's behaviour over the coming sessions is the more informative reading — continued expansion would show follow-through demand, while a rapid contraction back toward zero would mark the move as a spike that is already exhausting.
④ RSI

RSI closed at 77.47, well inside overbought territory. The generator also flags a regular bearish divergence between two specific peaks: 2026-07-09 at price $9.82 with RSI 85.58, and 2026-08-14 at price $12.32 with RSI 77.47. Price made a decisively higher high; RSI made a lower high. That is the standard divergence pattern.
Two qualifications keep this honest. First, a divergence is a possibility of reversal, not a confirmation — nothing about the current chart establishes a top, and confirmation would require price itself to fail at a level. Second, the July 9 peak carried an RSI of 85.58, an extreme reading; a lower high measured against an extreme is a weak form of the pattern and frequently resolves through sideways digestion rather than reversal. Overbought is also not a sell signal in its own right — strong advances routinely hold RSI above 70 for extended runs. The useful line is the 50 level: a retreat that holds above it would mark healthy consolidation, while a break under it would indicate the August move has lost its footing.
⑤ Mansfield Relative Strength

Mansfield RS versus the Nasdaq Composite reads +33.68, state "outperform", slope rising, and it is identical on both the 2-year and 90-day panels as an anchor-free measure should be. One week ago the same measure stood at 3.57 and one month ago at 14.27, so the weekly change is +30.11 and the monthly change is +19.42 — positive territory with positive change on both horizons, the accelerating quadrant.
The one-month path is instructive: RS was at 14.27 a month ago, had faded to 3.57 by last week, and then jumped thirty points in a single week. So the medium-term picture is not one of steady, grinding outperformance but of a relative-strength line that had almost given back its edge before the August event restored it in two sessions. Deep positive RS is a genuine tailwind for swing structures, and this is the highest reading in the visible window. It is also the most event-dependent RS reading on the page, and unwinding it would require far less than two sessions of relative weakness.
⑥ ATR & ADX

ATR stands at $0.58, or 4.685% of the share price. That is a high-volatility profile, and it is the number that should drive position sizing rather than any level on the price chart. A single average day moves this stock roughly 58 cents; the standard 2×ATR invalidation reference therefore sits at $11.17, which is 9.37% below the close. The 1×ATR reference at $11.74 is inside normal daily noise and would be triggered by an ordinary session, not by a change of structure.
ADX reads 24.41 on the 2-year panel and 24.73 on the 90-day panel — the "emerging" state, still below the conventional 25 threshold for a confirmed trend. This is the most quietly informative reading here. Despite one of the largest two-day advances in the stock's visible history, trend strength has not yet crossed into confirmed territory, because ADX measures sustained directional persistence rather than the size of any one move. Note also that ADX is a magnitude, not a direction: a rise above 25 would confirm that a trend has taken hold, and the price structure would still have to be read separately to know which way it points.
⑦ OBV

OBV is tagged early accumulation and sits above its 20-day moving average on both timeframes, but the magnitudes differ and both are worth stating. On the 2-year panel OBV is 77,524,100 against an MA20 of 63,470,610, a divergence of +22.14%. On the 90-day panel it is 50,163,500 against 36,110,010, a divergence of +38.92%. The wider short-term gap simply reflects that the recent volume burst is a much larger share of a 90-day base than of a 2-year base.
The slope on both timeframes is tagged flat, and that combination — level far above the average, slope flat — is exactly what a step-change looks like rather than a trend. Cumulative volume jumped in two sessions and has not yet established a direction from its new plateau. There is no bearish non-confirmation here (OBV made a high alongside price, not behind it), but neither is there yet the steadily rising OBV line that marks genuine multi-week accumulation. That distinction is the single most useful thing to track from here.
Bull vs Bear
Bull Case
- Full bullish moving-average stack: close $12.32 > SMA5 $10.21 > SMA20 $9.70 > SMA60 $8.62.
- Mansfield RS at +33.68 versus the Nasdaq Composite, rising, and in the accelerating quadrant on both the weekly (+30.11) and monthly (+19.42) change.
- MACD golden cross on August 13 with both lines above zero and a histogram of +0.1745.
- Volume of 7,333,000 versus a 20-day average of 2,574,455 (2.85×) — the advance is participation-confirmed, not a thin-tape drift.
- OBV above its MA20 on both timeframes (+22.14% on 2y, +38.92% on 90d), tagged early accumulation, with no bearish non-confirmation.
- Price sits far above both anchored VWAPs ($8.24 on 2y, $8.82 on 90d), so there is little trapped supply between the current price and the year's base.
Bear Case
- RSI at 77.47 with a flagged regular bearish divergence: price $9.82 / RSI 85.58 on July 9 versus price $12.32 / RSI 77.47 on August 14 — higher price high, lower RSI high.
- The close is $1.06 above the upper Bollinger band of $11.26, with band width already stretched to 32.16%.
- Price is 1.60% under the 52-week high of $12.52, a level that immediately overhangs any further advance.
- ADX at 24.41 remains "emerging" — after a move of this size, trend strength still has not confirmed above 25.
- ATR is 4.685% of price; the routine 2×ATR invalidation at $11.17 is a 9.37% drawdown, so ordinary volatility is expensive here.
- The entire bullish configuration was created by two sessions, and it leaves an unfilled gap at $9.16–$9.58 (August 13) beneath price — unfilled gaps act as magnets and this one sits 22%+ below the close.
Scenarios
| Scenario | Probability | Path | Trigger / Invalidation |
|---|---|---|---|
| A. Breakout holds | 45% | Price consolidates above the 23.6% retracement at $11.52, works through the $12.52 52-week high, and ADX crosses 25 as the histogram keeps expanding. | Trigger: a close above $12.52 on volume at or above the 20-day average. Invalidation: a close back below $11.17. |
| B. Digestion inside the swing | 35% | The advance stalls and price retraces into the $10.63–$11.03 band (50%–38.2% of the August swing) while RSI unwinds from 77 toward 50, then bases sideways. | Trigger: loss of $11.52 without a same-day reclaim. Invalidation: a close back above $12.32 that keeps RSI over 70. |
| C. Failed spike / gap fill | 20% | The bearish divergence resolves downward, the move gives back its two-session gain, and price gravitates to the unfilled $9.16–$9.58 gap and the SMA20 at $9.70. | Trigger: a close below the 61.8% retracement at $10.24. Invalidation: a reclaim of $11.52 with expanding volume. |
Key Levels
| Price | Role | Basis |
|---|---|---|
| $12.52 | Resistance | 52-week high — first overhead reference above the close |
| $12.32 | Last close | August 14 close · 0% of the current swing (fibonacci anchor high) |
| $11.52 | Support | 23.6% retracement of the $8.95–$12.32 swing |
| $11.26 | Support | Upper Bollinger band — price is currently above it |
| $11.17 | 2×ATR stop | Objective invalidation reference — 9.37% below the close |
| $11.03 | Support | 38.2% retracement of the current swing |
| $10.63 | Support | 50% retracement of the current swing |
What to Watch
- Volume decay pattern. After a 2.85× session, healthy consolidation shows volume tapering while price holds. Renewed heavy volume on down days would say the August buyers are exiting.
- The $11.52 line. The 23.6% retracement is the shallowest give-back consistent with an intact breakout. Holding it keeps scenario A alive; losing it moves the reference band to $11.03–$10.63.
- OBV slope, not level. The OBV level is already elevated. What matters now is whether the flat slope turns up from its new plateau — that is the difference between a step-change and real accumulation.
- ADX crossing 25. Trend strength has not confirmed. A cross above 25 with price holding above $11.52 would be the cleanest corroboration available; ADX rising while price falls would mean the confirmed trend is the wrong one.
- The unfilled $9.16–$9.58 gap. It sits well below price and does not need to fill soon, but any move back into the $10 handle puts it in play as the next magnet.
Conclusion
Past Analyses of This Stock same ticker · newest first
Other signals from this issue same publication date · 7 stocks
This analysis is an educational interpretation of chart data and is not investment advice. Probabilities and levels are subjective estimates; every investment decision, and its outcome, is your own responsibility. This page reads price and volume structure only — it does not assess the company's business, valuation or news flow. Where a chart shows a sudden, high-volume price shock, technical signals alone are not a basis for buying: verify the underlying catalyst first.
Two Week Swing · twoweekswing.com · 4,600+ stocks screened weekly