Harmony Biosciences Holdings, Inc.
$38.12 −6.7% from the 52-week high ($40.87)
This analysis is based on closing-price data as of August 14, 2026. Whether you're researching how to buy Harmony Biosciences Holdings, Inc. stock or you've just opened a brokerage account and are trying to time an entry, here are objective support levels and stop-loss references built from the RSI, MACD and ATR indicators.
Two years of data show a stock that spent most of 2025 grinding sideways-to-lower between roughly $26 and $40, then bottomed at the $25.52 52-week low and has climbed steadily since the February 20, 2026 anchor. That recovery has now carried price back to the upper edge of the two-year range — $38.12, just 6.7% below the $40.87 52-week high — with the moving averages stacked bullishly (SMA5 $38.98 > SMA20 $36.99 > SMA60 $35.00) and Mansfield RS finally above zero at +1.97%. The near-term question is narrower: after tagging $39.77 on August 12, price faded two sessions on very light volume, and the RSI reading behind that high was materially lower than the July peak. This page reads the advance and that fade side by side.
Snapshot values as of the August 14, 2026 close
| Metric | Value | Read |
|---|---|---|
| Close | $38.12 | Below SMA5, above SMA20 and SMA60 |
| 52-week high / low | $40.87 / $25.52 | −6.7% from the high, +49.4% off the low |
| SMA5 / SMA20 / SMA60 | $38.98 / $36.99 / $35.00 | Bullish stack, all rising |
| Bollinger (20) upper / mid / lower | $40.62 / $36.99 / $33.36 | Band width 19.62% — expanded, not pinched |
| aVWAP — 2y anchor (Feb 20, 2026) | $31.95 | Price well above the long-term anchor |
| aVWAP — 90d anchor (May 7, 2026) | $34.44 | Short-term buyers also in profit |
| RSI(14) | 56.0 | Neutral-positive; bearish divergence flagged |
| Mansfield RS vs the Nasdaq Composite | +1.97% | Outperform, slope rising (prior week +2.65%, prior month −6.73%) |
| MACD / signal / histogram | 1.024 / 0.898 / +0.127 | Golden cross on August 4, 2026; histogram positive |
| ADX(14) | 29.2 (2y) · 29.5 (90d) | Strong trend strength — direction is set by price, not ADX |
| ATR(14) | $1.393 (3.66% of price) | Roughly a $1.39 average daily range |
| OBV state | 2y: accumulation (+35.97% vs MA20) · 90d: accumulation (+17.56%) | Above its MA20 and rising on both timeframes |
| Volume (last / 20-day avg) | 388,600 / 863,235 — 0.45× | The pullback is happening on unusually thin trade |
| 1× / 2× ATR stop reference | $36.73 / $35.33 | −3.65% / −7.31% from the close |
① Price & Moving Averages
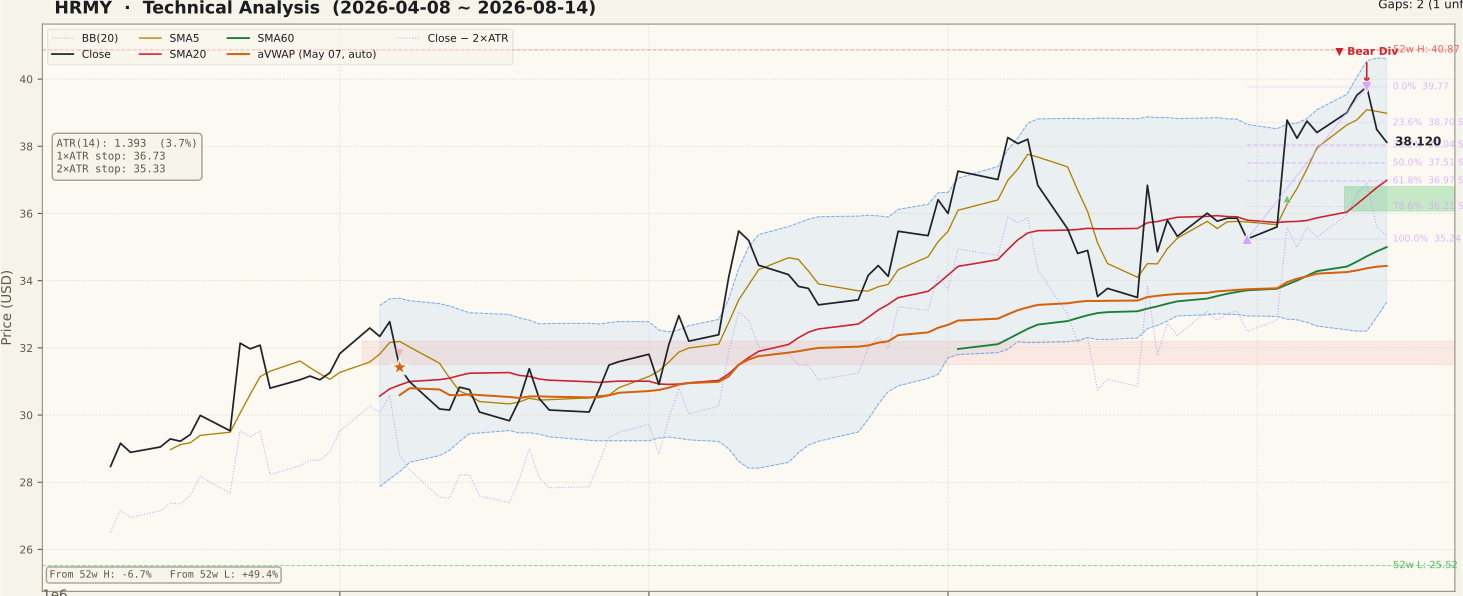
The moving-average structure is textbook constructive: SMA5 $38.98 sits above SMA20 $36.99, which sits above SMA60 $35.00, and all three slope upward. Price at $38.12 has slipped beneath the 5-day line but remains comfortably above the 20- and 60-day averages, which is what a pause inside an uptrend normally looks like rather than a break of one. The Bollinger mid-band coincides exactly with SMA20 at $36.99, so that figure carries double weight as the first structural line beneath the market; the upper band at $40.62 sits just under the $40.87 52-week high, framing a tight overhead cluster.
Both anchored VWAPs are well below price — $31.95 from the February 20, 2026 anchor on the two-year chart and $34.44 from the May 7, 2026 anchor on the 90-day chart — meaning the average buyer from either anchor point is in profit and has little forced-selling pressure. Retracement levels from the July 31 low ($35.24) to the August 12 high ($39.77) put the 23.6% line at $38.70 and the 38.2% line at $38.04; Friday's close of $38.12 is wedged between them, which is a shallow give-back so far. The unfilled gap left on August 4 between $36.07 and $36.80 is the clearest magnet-and-support zone underneath.
② Volume

Friday's 388,600 shares came in at 0.45× the 20-day average of 863,235 — less than half of normal participation. In the context of a two-day fade from the high, thin volume is the more favourable reading: sellers are not pressing, they are simply absent. Compare that with the August 4 session, which traded 1,991,500 shares — roughly 2.3× the 20-day average — as price gapped up and left the $36.07–$36.80 void behind. That is the volume signature that built this leg.
The caution is symmetrical. Low volume cuts both ways: it makes the pullback look benign, but it also means the move up to $39.77 was not re-confirmed by fresh demand. Any attempt back through $38.70 and $39.77 that arrives on sub-average volume deserves scepticism — an unconfirmed breakout is one of the most common traps for newer chart readers. Turnover at this price level averages roughly $31 million a day, so liquidity itself is not a constraint here.
③ MACD

MACD is at 1.024 against a signal line of 0.898, with the histogram positive at +0.127. The last crossover was a golden cross on August 4, 2026 — the same session as the gap — so the momentum signal and the price event share a date, which makes the cross a description of that gap rather than an independent confirmation of it.
Both lines are well above zero, which places this in the mature rather than the early stage of a momentum cycle; crossovers that occur far above zero have less room to expand than those that fire from below it. The histogram is still positive but modest, and on the 90-day panel it has been flattening over the past few sessions. A histogram that shrinks toward zero while price holds up is the earliest, softest warning that the advance is losing thrust — not a reversal signal on its own, but worth logging.
④ RSI

RSI(14) reads 56.0 — neutral-positive, comfortably clear of both the 70 overbought line and the 30 oversold line, with room to move in either direction. The generator flags a bearish divergence, and the two peaks are specific: July 7, 2026 at $38.26 with RSI 72.98, then August 12, 2026 at $39.77 with RSI 66.18. Price made a higher high of $1.51 while RSI made a lower high of nearly seven points.
That is a genuine negative divergence and it is the single most important bearish item on this page. It is also the item most often over-read. A divergence describes weakening momentum behind a new high; it says nothing about when, or whether, price will turn. Divergences can persist for weeks and can be erased entirely by one strong session that drives RSI back above the prior peak. Until price actually loses a structural level — the $36.99 SMA20 and mid-band being the obvious one — this is a reason for tighter risk discipline, not a top call.
⑤ Mansfield Relative Strength

Mansfield RS versus the Nasdaq Composite is +1.97% with a rising slope — the stock is outperforming the index, and on the two-year panel this is the first sustained move above the zero line since early 2025. The prior-month reading was −6.73%, so the month-over-month change is +8.70 points: firmly positive territory and still accelerating on that horizon. That transition from deep underperformance to outperformance is the structural change on this chart.
The weekly picture is more nuanced. The prior-week reading was +2.65%, so the week-over-week change is −0.68 points — still positive, but decelerating. In other words, relative strength remains above zero while the rate of improvement has eased in the last five sessions, which lines up with the price fade from $39.77 and with the RSI divergence. A reading above zero that stops rising is the first thing to monitor; a drop back below zero would be a more serious signal, because it would mean the recovery is once again lagging the index.
⑥ ATR & ADX

ATR(14) is $1.393, or 3.66% of price — a typical daily swing of about a dollar and forty cents. That figure is the basis for position sizing and for the objective invalidation levels used throughout this page: 1× ATR below the close is $36.73 (−3.65%) and 2× ATR below is $35.33 (−7.31%). Note that 2× ATR lands almost exactly on the $35.24 origin of the current swing, which means the volatility-based stop and the structural low agree — a useful coincidence when two independent methods point to the same shelf.
ADX(14) reads 29.2 on the two-year window and 29.5 on the 90-day window, both classified as a strong trend. ADX measures trend strength only, never direction — a high ADX during a decline signals a strong decline. Here the direction is set by the rising moving-average stack, so a strong ADX supports the existing up-move. The 90-day ATR panel shows volatility stepping up in July and August relative to the quiet May–June stretch, so risk per share is larger now than it was mid-summer.
⑦ On-Balance Volume

OBV agrees across both timeframes, which is not always the case. On the two-year series OBV is at 3,707,000 against an MA20 of 2,726,430 — accumulation, above its average and rising, a 35.97% divergence in favour of buyers. On the 90-day series it is 6,565,400 against an MA20 of 5,584,830 — also accumulation, also above and rising, at a 17.56% spread.
This is the counterweight to the RSI divergence. When price makes a new high and OBV lags, the high is unconfirmed; here OBV is not lagging on either horizon, so the cumulative volume flow still supports the advance even though the momentum oscillator does not. The honest way to hold both facts at once: buying pressure has been real, but the last push required less of it than the July push did.
Bull vs Bear
Bull Case
- Bullish moving-average stack — SMA5 $38.98 > SMA20 $36.99 > SMA60 $35.00, all rising.
- Mansfield RS at +1.97% versus the Nasdaq Composite, above zero for the first sustained stretch since early 2025 (+8.70 points month-over-month).
- OBV in accumulation on both timeframes — above its MA20 and rising, +35.97% (2y) and +17.56% (90d).
- MACD positive with a golden cross on August 4, 2026 and a histogram still above zero at +0.127.
- Price is +49.4% off the $25.52 52-week low and holding well above both anchored VWAPs ($31.95 and $34.44).
- The pullback from $39.77 has come on 0.45× average volume — absence of sellers rather than pressure from them.
Bear Case
- Confirmed RSI bearish divergence: $38.26 with RSI 72.98 on July 7 versus $39.77 with RSI 66.18 on August 12.
- Weekly Mansfield RS change is −0.68 points — still positive but decelerating in the last five sessions.
- Price failed at $39.77, just under both the $40.62 upper Bollinger band and the $40.87 52-week high — a dense overhead cluster.
- MACD lines are far above zero, the late rather than early part of a momentum cycle, with the histogram flattening.
- Two years of data show repeated failures in the $38–$41 zone; the stock has not sustainably cleared it since 2024.
- An unfilled gap at $36.07–$36.80 sits below and gaps act as magnets — a 6% air pocket the market may want to revisit.
Scenarios
| Scenario | Probability | Path | Trigger / Invalidation |
|---|---|---|---|
| Shallow pause, then retest of the range top | 50% | Holds the $38.04–$38.70 retracement band or the $36.99 SMA20, then works back toward $39.77 and the $40.62–$40.87 cluster. | Trigger: a close back above $38.70 on volume above the 863,235 average. Invalidation: a daily close below $36.99. |
| Deeper retracement into the gap | 32% | The RSI divergence resolves lower; price works through $37.51 and $36.97 into the unfilled $36.07–$36.80 gap, where SMA60 at $35.00 sits just beneath. | Trigger: consecutive closes below $38.04. Invalidation: a reclaim of $39.77. |
| Failed recovery, back to the swing origin | 18% | The gap fails to hold and price returns to the $35.24 swing origin — the same shelf as the 2× ATR reference at $35.33 — putting the entire August advance back on the table. | Trigger: a close below $36.07 (bottom of the gap). Invalidation: recovery of the $36.99 SMA20 and mid-band. |
Key Levels
| Price | Role | Basis |
|---|---|---|
| $39.77 | Resistance | August 12, 2026 swing high — 0% of the retracement swing; $40.62 upper band and the $40.87 52-week high sit just above |
| $38.70 | Support (fib) | 23.6% retracement of the July 31–August 12 advance; price slipped just under it on August 13–14, so it is currently the nearest overhead line |
| $38.12 | Current close | August 14, 2026 close |
| $38.04 | Support | 38.2% retracement — the first shelf directly beneath price |
| $36.99 | Support | SMA20 and Bollinger mid-band, coinciding with the 61.8% retracement at $36.97 — the structural line for this move |
| $36.80–$36.07 | Support | Unfilled gap from August 4, 2026 — the most likely magnet zone on a deeper give-back |
| $35.33 | 2× ATR stop | Objective invalidation, −7.31% from the close; effectively the same shelf as the $35.24 swing origin |
What to Watch
- Whether $38.70 (23.6% retracement) is reclaimed, and on what volume — a reclaim on less than the 863,235 average is not confirmation.
- The RSI divergence: it is erased if RSI drives back above the 66.18 reading that accompanied the $39.77 high, and it is confirmed only if price loses $36.99.
- Mansfield RS versus the Nasdaq Composite — the weekly change has already turned negative at −0.68 points; a slide back below zero would undo the structural improvement.
- The unfilled $36.07–$36.80 gap: whether it acts as support on a test, or fills and keeps going toward $35.24.
- The MACD histogram at +0.127 — a cross back below zero would mark the momentum cycle rolling over.
Conclusion
Past Analyses of This Stock same ticker · newest first
Other signals from this issue same publication date · 7 stocks
This analysis is an educational interpretation of chart data and is not investment advice. Probabilities and levels are subjective estimates; every investment decision, and its outcome, is your own responsibility. Chart indicators describe what price has already done — they cannot account for company news, earnings or regulatory events that have not yet occurred.
Two Week Swing · twoweekswing.com · 4,600+ stocks screened weekly