Savers Value Village, Inc.
$10.66 −23.3% from 52-week high
This analysis is based on closing-price data as of August 14, 2026. Whether you're researching how to buy Savers Value Village, Inc. stock or you've just opened a brokerage account and are trying to time an entry, here are objective support levels and stop-loss references built from the RSI, MACD and ATR indicators.
SVV spent the first half of 2026 repairing the damage from an October 31, 2025 collapse, and the repair finally accelerated in August: from a $9.02 close on July 23 the stock ran twelve sessions to $12.29 on August 10, a gain of roughly 36%, taking Mansfield relative strength above zero for the first time in months. Then August 12 gapped it straight back down — open $10.99 against the prior close of $11.80, a $10.71 finish, and 10,168,200 shares traded against a 20-day average of 1,753,290. The August 14 close of $10.66 sits almost exactly on the 50% retracement of that entire advance ($10.655), which is why this chart is interesting rather than resolved: a strong leg was interrupted by a single news-shaped session, and the stock is now holding the midpoint of it.
Snapshot all values from the August 14, 2026 close
| Item | Value | Reading |
|---|---|---|
| Close | $10.66 | −23.3% from 52w high / +54.4% from 52w low |
| 52-week high / low | $13.89 / $6.91 | Upper half of a wide yearly span |
| SMA 5 / 20 / 60 | $11.26 / $10.46 / $9.81 | Above SMA20 and SMA60; the close is back under SMA5 |
| Bollinger (upper / mid / lower) | $12.29 / $10.46 / $8.62 | Band width 35.08% — wide after the August expansion; close just above the midline |
| aVWAP (90d, anchored May 20, 2026) | $10.02 | Price above — buyers since the May base are still in profit |
| aVWAP (2y, anchored October 31, 2025) | $9.28 | Price above the long-term anchor set on the gap-down session |
| RSI (14) | 52.1 | Neutral after a reset from above 70; no divergence flagged |
| Mansfield RS (vs the S&P 500) | −4.6% | Back below zero: +4.1 pts vs a month ago, but −13.9 pts on the week |
| MACD (12,26) | 0.397 / signal 0.396 / hist +0.001 | Golden cross on Jul 30, both lines above zero — but the histogram has collapsed to the line |
| ADX (14) | 25.5 (2y frame 25.1) | Just above the 25 threshold — the August move had trend character |
| ATR (14) | $0.61 (5.7% of price) | Wide daily ranges — basis for stop sizing |
| OBV | 2y: improving (−16.87% vs MA20, rising) / 90d: improving (−12.97%, rising) | Rising on both frames, but still under the 20-day average on both |
| Volume vs 20-day avg | 1.35× (2,371,100 vs 1,753,290) | Above normal — the market is still working through the August 12 session |
| 1× / 2× ATR stop | $10.05 / $9.44 | Objective invalidation references |
① Price & Moving Averages
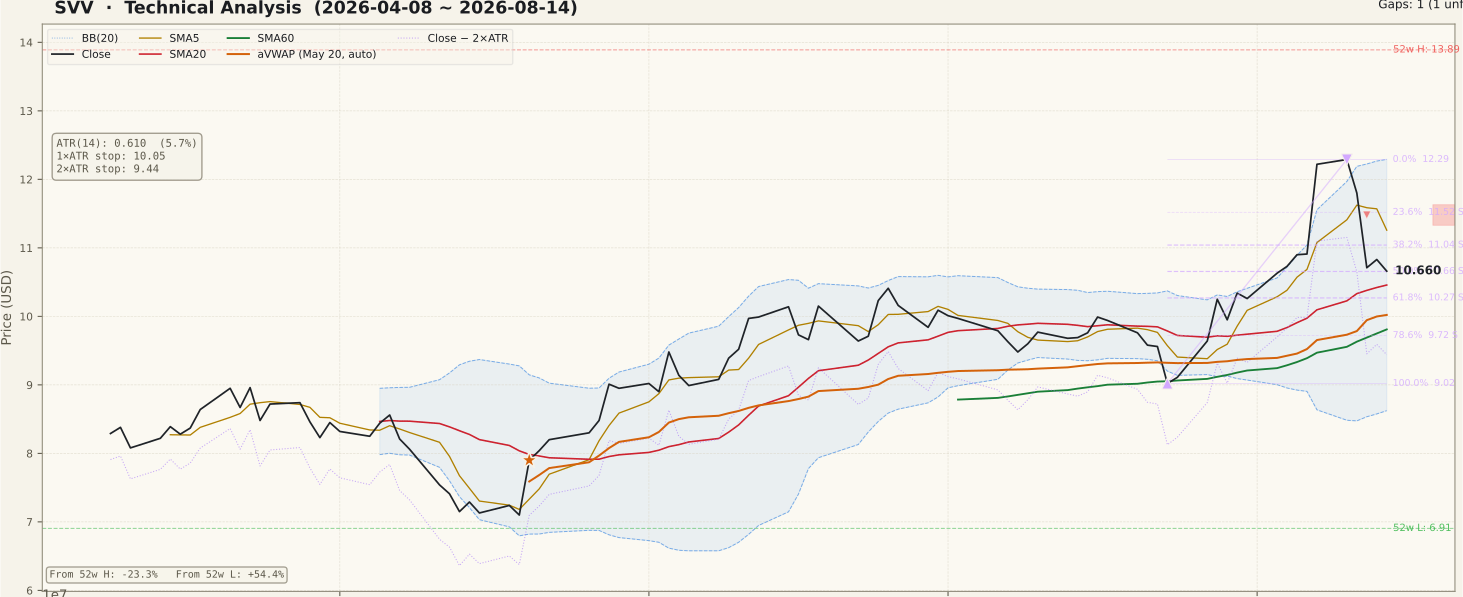
The two-year frame sets the terms. SVV traded in the $9–$12 area through 2024 and into 2025, then climbed to a 52-week high of $13.89 in late September 2025 before October 31, 2025 changed the chart in a single session: the stock opened at $11.43 against the previous close of $13.23 and finished at $9.21 on 7,948,800 shares. That day left an unfilled gap at $11.49–$12.98 that has capped the chart ever since, and it is also where the two-year anchored VWAP is set, at $9.28. The eight months that followed were a base — a February 2026 rally to $11.53, a slide to the 52-week low of $6.91 on March 27, and a second trough at a $7.10 close on May 19. The 90-day panel picks up from that base: a steady climb through June, a July drift back to $9.02 on July 23, and then the August leg that carried price from $9.02 to $12.29 on August 10 — through SMA20, SMA60 and both anchored VWAPs. August 12 undid a large part of it. The close of $10.66 is still above SMA20 ($10.46), SMA60 ($9.81), the 90-day aVWAP ($10.02) and the two-year aVWAP ($9.28), but it is under SMA5 ($11.26), so the newest short-term average has flipped overhead. Above price the obstacles are stacked and specific: a fresh unfilled gap at $11.33–$11.63 from August 12, the 23.6% retracement at $11.52 inside it, the 38.2% retracement at $11.04 just under it, and then the $12.29 ceiling where the August 10 swing high and the upper Bollinger Band sit on the same line — with the October 2025 gap zone starting immediately above that. Below, the 50% retracement at $10.655 is precisely where Friday closed, then SMA20 and the Bollinger midline at $10.46, the 61.8% retracement at $10.27, SMA60 at $9.81 alongside the 78.6% retracement at $9.72, and the July 23 low at $9.02, which is the 100% mark of the swing.
② Volume

The last five sessions dominate the panel, and they tell two different stories. August 7 carried 2,947,000 shares into a $12.22 close, up from $10.91 — heavy participation on the way up. August 12 then printed 10,168,200 shares, roughly 5.8 times the 20-day average of 1,753,290 and by a wide margin the largest bar of the entire 90-day window, into a close of $10.71 after opening $0.81 below the previous close. The final session traded 2,371,100 shares, or 1.35× average, so activity has stepped down but has not normalised. Liquidity itself is not an issue here — a 20-day average near 1.75 million shares at roughly $10 is a real tape, not a thin one — which means the August 12 bar represents genuine crowd behaviour rather than a slippage artifact. The common beginner error at this point is to read the huge red bar as an automatic reversal signal, or the two green bars that followed as automatic absorption. Neither conclusion is available yet. What matters over the next sessions is the ratio: shrinking volume while price holds $10.46–$10.66 reads as digestion, while expanding volume on lower closes reads as supply that has not finished.
③ MACD

MACD reads 0.397 against a signal of 0.396, leaving a histogram of just +0.001, following a golden cross dated July 30. Both lines sit well above zero, which is the constructive half of the reading — momentum built from a positive base rather than clawing back from a deficit. The histogram is the uncomfortable half. The 90-day panel shows it expanding to roughly +0.24 during the run into August 10 and then collapsing in three sessions to essentially nothing, which means the two lines are now touching and a dead cross is one weak session away. That is what a sharp gap does to a momentum oscillator: it does not merely pause the signal, it removes the spread that made the signal readable. The two-year panel is a useful check on scale, showing MACD swinging beyond ±1.0 around the October 2025 event, so the current absolute readings are moderate for this stock. From here the histogram is the practical tell — green bars re-expanding while price holds above $10.46 would mean the July 30 cross survived the shock, while a cross back below the signal line would confirm that August 10 was the momentum peak of this leg.
④ RSI

RSI stands at 52.1 on both timeframes — the middle of the range, with the 70 overbought line and the 30 oversold line both far away. The 90-day arc is worth tracing because it explains the current setup: RSI bottomed near 30 during the May base, rose through the 50 line in early June and held the 50–70 band for most of June and July, pushed above 70 during the August 7–11 thrust, and then fell back to 52 in the space of three sessions. A reset of that speed from overbought to neutral, without a break below 50, is the shape that follows a sharp pullback inside a rising structure — but it is equally the first half of a top, and only price resolves which. No divergence is flagged in the data on either timeframe and the peak fields are empty, so there is no bearish non-confirmation to report; inferring one from the picture alone would be a mistake. The levels that matter next are 50 on the way down, which has been the floor of every pullback since the May base, and 70 again on the way up, which would accompany a genuine attempt at the August 12 gap.
⑤ Mansfield Relative Strength

Mansfield RS versus the S&P 500 reads −4.6%, and the two changes point in opposite directions in an unusually sharp way. A month ago RS was −8.7, so the line has improved by +4.1 points over the month — in negative territory that is a closing deficit, not leadership. A week ago it was +9.3, so the line has fallen 13.9 points in five sessions and has been pushed back below zero. That single number is the cleanest summary of what August 12 cost this chart: the stock had just achieved what it had failed to achieve all year — outperformance of the index — and gave it back immediately. The data tags the RS slope as rising, which reflects the month-scale recovery from the spring lows rather than the past week; the 90-day panel shows both facts at once, a long climb from around −38 in May to a brief green patch above zero, then a vertical drop back into red. The two-year panel keeps it in proportion: RS has been below zero for almost the entire period since October 2025. Persistent sub-zero relative strength outranks a good deal of bullish short-term evidence, and the zero line is the level that would change the assessment.
⑥ ATR & ADX

ADX is 25.5 on the 90-day frame and 25.1 on the two-year frame, tagged strong — just over the 25 line that separates a trending tape from a range. The nuance is that ADX measures intensity, not direction: it rose through the August advance and has stayed elevated through the reversal, so it confirms only that the last few weeks have been directional, not which way the next few will go. ATR is $0.61, or 5.7% of price, and the panel shows it stepping sharply higher in the final sessions as the daily ranges widened — a mechanical consequence of the gap. That figure governs risk directly: the 1×ATR reference sits at $10.05 and the 2×ATR reference at $9.44, which is 11.4% below the close. Anyone framing an invalidation level closer than about $0.61 from entry will be removed by ordinary daily noise in this name, so the correct adjustment is a smaller position rather than a tighter stop. The two-year chart also shows that this stock is capable of single sessions that travel through several levels at once — October 31, 2025 and August 12, 2026 are both on the same chart — which is exactly why the invalidation line belongs on paper before an entry rather than after one.
⑦ OBV (On-Balance Volume)

Both timeframes carry the same tag and the same caveat. On the 90-day frame OBV is improving: 12.97% below its 20-day average with a rising slope. On the two-year frame it is also improving, 16.87% below its MA20 and rising. Read together, buying pressure has been rebuilding since the spring, but on neither horizon has the line yet reclaimed its own average — the tag describes direction, not position, and it would be a misreading to treat "improving" as confirmation. The panel shows why the gap is so wide right now: OBV climbed steeply through the August advance to a local peak and then dropped almost vertically on the 10-million-share session, which is a single bar subtracting a fortnight of accumulation. That is the honest picture — the recovery in volume pressure is real on a multi-month view and has just taken a serious hit on a short-term view. OBV also lags at turning points, so the useful thing to monitor is simply whether the 90-day line keeps rising and closes the remaining 12.97% gap to its average, or rolls over again.
Bull Case vs Bear Case
Bull Case
- The close of $10.66 held the 50% retracement of the July 23–August 10 advance ($10.655) on its first test, with SMA20 $10.46 immediately beneath.
- Price remains above SMA20 $10.46, SMA60 $9.81 and both anchored VWAPs (90d $10.02, 2y $9.28) — buyers from the May base are still in profit.
- MACD golden cross on July 30 with both lines above zero (0.397 / 0.396), the first sustained positive momentum reading since the spring.
- OBV is rising on both timeframes and Mansfield RS has improved +4.1 points over the month, from −8.7 to −4.6.
- The structure since the March 27 low of $6.91 is a sequence of higher troughs — $7.10 on May 19, $9.02 on July 23 — and the close is +54.4% above that 52-week low.
- ADX 25.5 is above the 25 threshold and RSI has reset from above 70 to 52.1 without losing the 50 line, which is the shape of a pause inside a rising structure.
Bear Case
- August 12 opened at $10.99 against the previous close of $11.80 and finished at $10.71 on 10,168,200 shares — roughly 5.8× the 20-day average and news-shaped rather than chart-shaped.
- Mansfield RS was +9.3 a week ago and is −4.6% now: 13.9 points lost in five sessions, and back below zero versus the S&P 500.
- The MACD histogram has collapsed from roughly +0.24 to +0.001 — the two lines are touching and the July 30 cross is one weak session from flipping.
- OBV sits below its 20-day average on both frames (−12.97% on 90d, −16.87% on 2y) despite the rising tag.
- The close is back under SMA5 $11.26, and a new unfilled gap at $11.33–$11.63 now sits directly overhead, with the October 31, 2025 gap zone $11.49–$12.98 stacked above it.
- ATR at 5.7% of price puts the 2×ATR invalidation 11.4% away, and the stock is still −23.3% below its 52-week high of $13.89.
Scenarios
| Scenario | Probability | Path | Trigger / Invalidation |
|---|---|---|---|
| Basing on the retracement midpoint | ~40% | The $10.46–$10.66 shelf, where the 50% retracement, SMA20 and the Bollinger midline converge, absorbs the aftermath of August 12; price chops sideways for a week or two on shrinking volume while MACD flattens rather than crossing. | Trigger: daily closes staying inside $10.27–$11.04 with volume drifting back toward the 1,753,290 average. Fails on a close below $10.27. |
| Continuation of the give-back | ~35% | Supply from the gap session keeps arriving: price loses SMA20 $10.46 and the 61.8% retracement $10.27, then works toward SMA60 $9.81 and the 78.6% retracement $9.72, with the July 23 low of $9.02 as the last structural floor. | Trigger: a daily close below $10.27 on volume above average, with MACD crossing back under its signal. A close below $9.44 voids the setup outright. |
| Gap repair and retest of the highs | ~25% | Price reclaims SMA5 $11.26 and closes into the $11.33–$11.63 gap zone, filling it and re-opening the $12.29 ceiling where the August 10 high and the upper Bollinger Band coincide; the October 2025 gap $11.49–$12.98 is the wider objective overhead. | Trigger: a daily close above $11.63 on volume at or above the 20-day average, with Mansfield RS crossing back above zero. Invalidated by a close under $10.27. |
Key Levels
| Price | Role | Basis |
|---|---|---|
| $12.29 | Resistance | Fibonacci 0% of the July 23–August 10 up swing (August 10 swing high); upper Bollinger Band $12.29 on the same line |
| $11.63–$11.33 | Resistance | Unfilled gap from August 12, 2026; the 23.6% retracement $11.52 sits inside the zone |
| $11.26 | Resistance | SMA5, flipped overhead after the gap; the 38.2% retracement $11.04 immediately below it |
| $10.66 | Current price | August 14, 2026 close — effectively on the 50% retracement of the swing at $10.655 |
| $10.46 | Support | SMA20 and Bollinger midline; the 61.8% retracement $10.27 just underneath |
| $9.81 | Support | SMA60, with the 78.6% retracement $9.72 alongside |
| $9.44 | Stop-loss | 2×ATR stop — objective invalidation (−11.4% from the close); the July 23 low $9.02, Fibonacci 100% of the swing, lies beneath |
What to Watch
- The $10.46–$10.66 shelf: the 50% retracement, SMA20 and the Bollinger midline are stacked there; holding it keeps the higher-trough sequence from March intact, and losing it puts the 61.8% level at $10.27 in play immediately.
- Volume character after the 10,168,200-share session: shrinking volume on sideways trade reads as digestion; expanding volume on lower closes reads as supply that has further to go.
- The MACD histogram at +0.001: the July 30 golden cross is intact only in name until the histogram re-expands — a cross back below the signal line would mark August 10 as the momentum peak.
- Mansfield RS and the zero line: the line touched +9.3 a week ago and is −4.6% now; reclaiming zero is the confirmation that the August advance was more than a one-off.
- The August 12 gap at $11.33–$11.63: unfilled downside gaps act as magnets and as resistance; a daily close above $11.63 is the first evidence that the session has been fully absorbed.
Conclusion
Past Analyses of This Stock same ticker · newest first
Other signals from this issue same publication date · 7 stocks
This analysis is an educational interpretation of chart data and is not investment advice. Probabilities and levels are subjective estimates; every investment decision, and its outcome, is your own responsibility. This stock experienced a large gap and volume shock within the past week whose cause cannot be identified from chart data alone — technical signals describe what the chart has done, not what the company will do, so always weigh fundamentals and your own risk tolerance before acting.
Two Week Swing · twoweekswing.com · 4,600+ stocks screened weekly