Jefferson Capital, Inc.
$24.00 −1.2% from the 52-week high · +54.8% from the 52-week low
This analysis is based on closing-price data as of August 14, 2026. Whether you're researching how to buy Jefferson Capital stock or you've just opened a brokerage account and are trying to time an entry, here are objective support levels and stop-loss references built from the RSI, MACD and ATR indicators.
Jefferson Capital spent the spring in a steady slide, bottomed at $15.50 in June, and has been rebuilding ever since — a recovery that turned into an outright expansion on the final session of the week. The August 14 close of $24.00 came on volume 3.70× the 20-day average, printed a new 52-week high of $24.28 intraday, and pushed price clean outside the upper Bollinger band at $22.73 with RSI at 83.2. Every trend indicator now agrees — moving averages in full bullish stacking, ADX at 37.8, OBV in accumulation, Mansfield RS flipping positive for the first time since March — but the entire final leg happened in one session, and that is exactly the condition under which a chart is least useful on its own. This page reads the structure that was built over four months, then separates it from the single bar that re-priced it.
Snapshot as of August 14, 2026 close
| Close | $24.00 |
|---|---|
| 52-week high / low | $24.28 / $15.50 (−1.2% / +54.8%) |
| SMA 5 / 20 / 60 | $21.78 / $20.53 / $18.60 Close > 5 > 20 > 60 |
| Bollinger (20) | Upper $22.73 · Mid $20.53 · Lower $18.34 · width 21.37% |
| Anchored VWAP | 2y anchor (Jan 8, 2026): $20.07 · 90d anchor (Jun 26, 2026): $20.17 |
| RSI (14) | 83.2 (2y file) / 83.3 (90d file) — overbought |
| Mansfield RS vs the Nasdaq Composite | +7.44% · outperform · rising (prev week −4.88, prev month −8.49) |
| MACD (12,26,9) | MACD 0.876 · Signal 0.668 · Histogram +0.208 (golden cross Jun 11, 2026) |
| ADX (14) | 37.8 (2y) / 38.2 (90d) — strong trend |
| ATR (14) | $0.79 (3.30% of price) |
| OBV | 2y: accumulation, +72.56% vs MA20, rising · 90d: accumulation, +87.24% vs MA20, rising |
| Volume | 1,483,900 vs 20-day avg 400,730 = 3.70× |
| Stop reference | 1×ATR $23.21 · 2×ATR $22.42 (−6.6%) |
① Price & Moving Averages
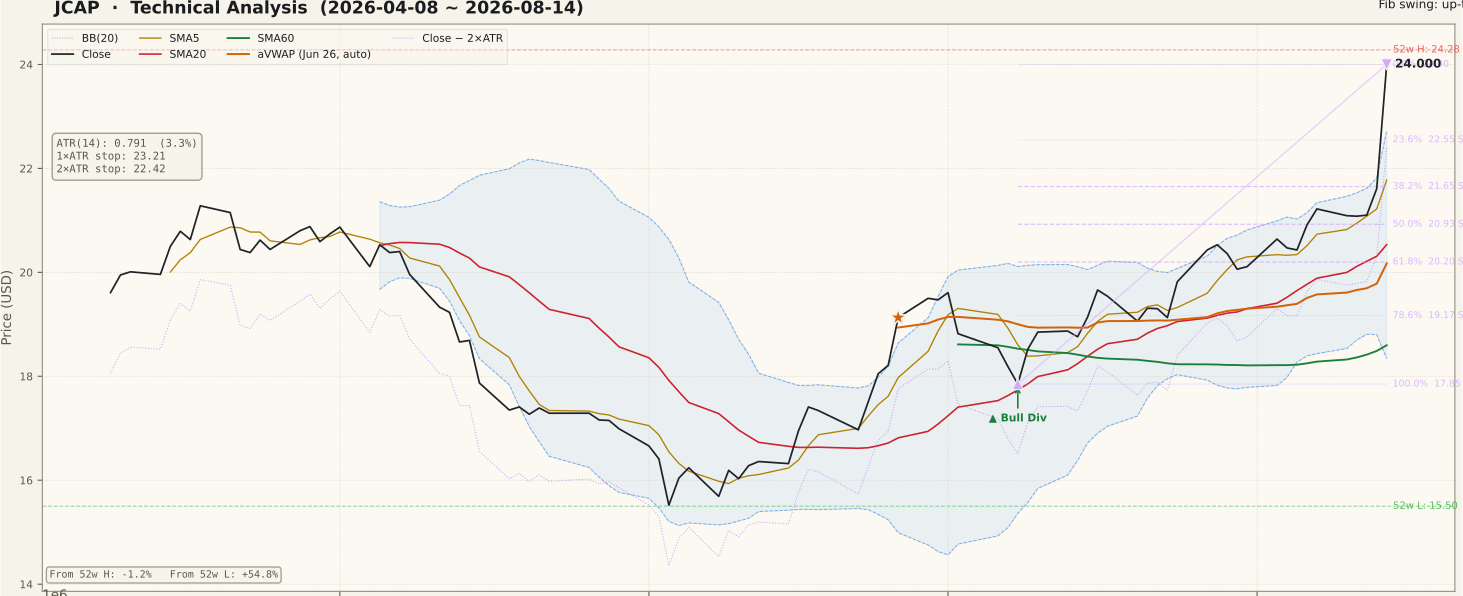
The moving-average stack is in textbook bullish order: close $24.00 above SMA5 $21.78, above SMA20 $20.53, above SMA60 $18.60, with all three curling upward. That alignment was earned gradually — SMA5 crossed back over SMA20 in early July and SMA20 recovered SMA60 through late July, well before the August 14 expansion. The Fibonacci frame is drawn on the up-swing from the $17.85 low of July 8 to the $24.00 high of August 14, so the retracement levels sit below as support: 23.6% at $22.55, 38.2% at $21.65, 50% at $20.93 and 61.8% at $20.20.
Two cautions belong here. First, the close is outside the upper Bollinger band ($22.73) with band width already at 21.37% — that is not a resistance reading so much as a statement that price has moved further than its own recent volatility regime accounts for. Second, both anchored VWAP references — the 2-year anchor at $20.07 (January 8, 2026) and the 90-day anchor at $20.17 (June 26, 2026) — now sit roughly four dollars below the close. Buyers across both windows are in profit, which removes overhead supply, but it also means the nearest genuine volume shelf is a long way down. The gap register lists no unfilled gaps.
② Volume

The August 14 session traded 1,483,900 shares against a 20-day average of 400,730 — a ratio of 3.70×, and the largest bar in the 90-day window by a wide margin. The closing-price file shows that session finishing roughly 11% above the prior close, opening above the prior day's entire range. On the confirmation question that most beginners get backwards, this is the good version of the answer: the move is not a thin-volume drift, it is a high-participation re-pricing.
The honest counterpoint is that volume confirms that something happened, never what. A 3.70× volume bar with a double-digit single-session advance is the signature of information arriving, not of a slow accumulation base completing. The July 1 session and the August 6 session also printed volume spikes, so participation had been building for weeks — but neither approached this scale. Note also the base rate: the 20-day average of 400,730 shares is modest, so a single institutional decision can dominate the tape here, and slippage on a thin book is a real cost around a bar like this one.
③ MACD

MACD is at 0.876 against a signal line of 0.668, with the histogram positive at +0.208. The governing cross is the golden cross of June 11, 2026, which occurred deep below the zero line — the early, high-quality variety, taken near the bottom of the decline rather than late in a move. That cross has held for over two months without a dead cross intervening, which is the single most durable piece of evidence on this chart.
The histogram tells the subtler story. It compressed through late July and early August as the advance became gradual, then widened sharply on the last bar. MACD is a lagging, smoothed construct, so a one-session histogram expansion of this size will keep the reading elevated for several sessions regardless of what price does next — it should not be read as fresh independent confirmation. What matters going forward is whether the histogram holds positive territory through the first pullback, not how tall it is today.
④ RSI

RSI(14) reads 83.2 in the 2-year file and 83.3 in the 90-day file — far into overbought territory, and the highest reading anywhere in either window. The chart also records a regular bullish divergence between two lows: May 4, 2026 at $20.11 with RSI 37.61, and July 8, 2026 at $17.85 with RSI 48.31 (the 90-day file logs 36.13 and 48.33 for the same two dates). Price made the lower low; momentum made the higher low.
That divergence is worth naming precisely because of what it already did: it resolved. The rally from $17.85 is the resolution. It is history now, not a forward-looking signal, and treating a spent divergence as continuing evidence is one of the more common ways a chart gets over-read. As for the 83 reading — overbought is a description of speed, not a sell trigger, and strong trends routinely hold RSI above 70 for extended stretches. The relevant caution is narrower: an RSI in the 80s means the reward for chasing has already been paid to someone else, and a return toward 60 can happen through sideways time rather than a price decline.
⑤ Mansfield Relative Strength

Mansfield RS against the Nasdaq Composite stands at +7.44%, above the zero line and rising. The trajectory is the story: one week ago the same measure was −4.88, and one month ago it was −8.49. That is a weekly change of +12.31 points and a monthly change of +15.92 points, so the stock is positive and accelerating — but only just. It crossed from underperformance into outperformance within the last week, and the 90-day panel shows the reading spent every prior session of that window below zero, at one point near −30.
This is where the two timeframes usefully disagree in emphasis while agreeing on the number (Mansfield RS is anchor-free, so both files read +7.44%). The 2-year panel shows JCAP held positive RS from December through March before a long deterioration; the 90-day panel shows only the deterioration and its repair. A fresh zero-line cross is a genuine change of character, but it has one week of history behind it. A reader who mistakes a one-week-old cross for an established leadership position is extrapolating from a single data point.
⑥ ATR & ADX

ADX reads 37.8 on the 2-year file and 38.2 on the 90-day file — comfortably in strong-trend territory, and importantly it was already climbing through late July, before the August 14 bar. ADX measures strength without direction, so its value here is confirming that the July and August advance was a trend rather than noise, not that the trend must continue.
ATR(14) is $0.79, or 3.30% of price. Two practical consequences. First, position sizing: at this volatility, a 2×ATR allowance is $1.58, which sets the objective invalidation at $22.42 — 6.6% below the close. Second, and this is the caveat that matters: ATR(14) is an average, and the August 14 range was several times a normal session. That single bar will keep pulling the ATR reading upward over the coming sessions, which means a stop distance calculated on today's $0.79 is calibrated to the volatility regime that existed before the expansion, not the one that exists now.
⑦ On-Balance Volume

Both timeframes read the same state, which is not always the case. The 2-year file shows OBV at 5,953,300 against an MA20 of 3,450,075 — accumulation, above its average, rising, and +72.56% above the moving average. The 90-day file shows 5,372,700 against 2,869,475 — accumulation, above, rising, +87.24%. Agreement across both windows is the cleaner version of this signal.
The divergence percentages are also a warning in disguise. OBV sitting 72% to 87% above its own 20-period average is an extreme stretch, and OBV is cumulative — the August 14 volume bar of 1,483,900 shares was added in full to the line. Much of that stretch is therefore one session, not a month of quiet accumulation. The constructive reading is that OBV had already crossed above its MA20 in early July and trended up before the spike; the cautious reading is that a cumulative indicator can only revert by trading sideways, so an extended OBV should be expected to compress rather than confirm.
Bull Case vs Bear Case
Bull Case
- Full bullish moving-average stacking — close $24.00 > SMA5 $21.78 > SMA20 $20.53 > SMA60 $18.60, all rising.
- MACD golden cross of June 11, 2026 struck deep below zero and has held for two months without a dead cross.
- Mansfield RS crossed into outperformance at +7.44%, a swing of +12.31 points in a week and +15.92 in a month.
- ADX at 37.8–38.2 confirms a strong trend that was already building before the final session.
- OBV in accumulation on both timeframes, above MA20 and rising, having crossed up in early July.
- Volume of 1,483,900 at 3.70× the 20-day average means the advance carried genuine participation, not a thin drift.
Bear Case
- RSI at 83.2 is the most stretched reading anywhere in either window, leaving no cushion for further speed.
- The close is outside the upper Bollinger band ($22.73) with band width already at 21.37% — an unsustainable position by construction.
- The final leg is a single session on 3.70× volume with no catalyst confirmed from chart data; the technical structure is not what re-priced it.
- Both anchored VWAPs sit near $20.07–$20.17, roughly four dollars below the close — the nearest real volume shelf is far away.
- ATR $0.79 predates the expansion bar, so the $22.42 stop is calibrated to a quieter volatility regime than the current one.
- The RS zero-line cross is one week old and the 90-day panel is otherwise entirely negative, reaching near −30 in June.
Scenarios
| Scenario | Probability | Path | Trigger / Invalidation |
|---|---|---|---|
| Digest and consolidate | 45% | The expansion bar cools off. Price gives back part of the move into the $22.55 (23.6%) to $21.65 (38.2%) retracement band, RSI unwinds from 83 toward 60, and SMA5 $21.78 catches up from below. | Confirmed by a hold above $21.65 on declining volume. Invalidated upward by an immediate close above $24.28, downward by a close under $20.93. |
| Trend extension | 35% | Follow-through on continued volume clears the 52-week high $24.28 and holds it. Bollinger band-walking develops, RS keeps accelerating from its fresh positive cross, and the $22.55 level converts from resistance-of-origin into support. | Trigger: a close above $24.28 with volume at or above the 20-day average. Invalidated by a close back below $22.42. |
| Round trip | 20% | The single-session move retraces in full. Price loses the 50% level $20.93 and the SMA20 $20.53, then works back toward the anchored VWAP shelf at $20.17–$20.07, where the July advance began to build. | Trigger: a close below $20.93 accompanied by expanding volume. Negated by reclaiming and holding $21.65. |
Key Levels
| Price | Role | Basis |
|---|---|---|
| $24.28 | Resistance | 52-week high, printed intraday on August 14 |
| $24.00 | Current | August 14 close · 0% of the Fibonacci up-swing (swing end) |
| $22.73 | Reference | Upper Bollinger band (20) — close is above it |
| $22.55 | Support | 23.6% retracement of the $17.85 → $24.00 swing |
| $22.42 | Stop (2×ATR) | Objective invalidation, −6.6% from the close |
| $21.78 | Support | SMA5, rising |
| $21.65 | Support | 38.2% retracement of the same swing |
What to Watch
- The follow-through session. Whether the next bar holds above $22.55 on normal volume separates a re-rating from a one-day event. A close back inside the Bollinger band on heavy volume is the opposite reading.
- The catalyst behind August 14. A 3.70× volume bar with a double-digit advance came from information, not from the moving averages. Identify it before treating any level on this page as a plan.
- Mansfield RS staying above zero. The cross is one week old. If RS slides back under the zero line, the leadership case reverts to what the 90-day panel showed all summer.
- MACD histogram behaviour on the first pullback. Holding positive territory keeps the June 11 golden cross intact; a dead cross would end the two-month structure.
- ATR re-rating. As the expansion bar enters the 14-period average, the volatility measure will rise and the 2×ATR distance will widen — the $22.42 reference is a snapshot, not a fixture.
Conclusion
Past Analyses of This Stock same ticker · newest first
Other signals from this issue same publication date · 7 stocks
This analysis is an educational interpretation of chart data and is not investment advice. Probabilities and levels are subjective estimates; every investment decision, and its outcome, is your own responsibility. This stock shows a fundamental-shock pattern within the last five trading days — technical signals alone are not a basis for a purchase decision, and the underlying catalyst should be verified independently.
Two Week Swing · twoweekswing.com · 4,600+ stocks screened weekly