Riskified Ltd.
$6.54 −1.06% from the 52-week high ($6.61)
This analysis is based on closing-price data as of August 14, 2026. Whether you're researching how to buy Riskified Ltd. stock or you've just opened a brokerage account and are trying to time an entry, here are objective support levels and stop-loss references built from the RSI, MACD and ATR indicators.
For roughly a year RSKD traded inside a low, flat range between the $3.70 area and the low-$5 area, and through late July it was still oscillating around a $5.20 midpoint. That changed on August 12, 2026: the stock gapped away from the range on enormous volume, left an unfilled gap at $5.34–$5.56, and by Friday's close at $6.54 it sat within a penny-and-a-half of its 52-week high of $6.61. Every trend gauge on the sheet flipped bullish at once — a golden MACD cross dated August 12, OBV in accumulation on both timeframes, and Mansfield RS jumping to +23.92% versus the S&P 500 — but the same three sessions pushed RSI to 81.5 and carried price above the upper Bollinger band. The lens here is a genuine range breakout that is, for now, badly extended from every reference level beneath it.
Snapshot as of August 14, 2026 close
| Metric | Value | Read |
|---|---|---|
| Close | $6.54 | Above every moving average and above the upper band |
| 52-week high / low | $6.61 / $3.70 | −1.06% from the high, +76.76% above the low |
| SMA5 / SMA20 / SMA60 | $5.98 / $5.40 / $5.12 | Bullish stack, but price is far above all three |
| Bollinger (upper / mid / lower) | $6.32 / $5.40 / $4.47 | Close is outside the upper band; width 34.27% |
| aVWAP — 90d | $5.20 | Anchor 2026-05-18; price well above |
| aVWAP — 2y | $4.78 | Anchor 2025-08-18; price well above |
| RSI (14) | 81.50 (2y panel 81.47) | Deep in overbought territory |
| Mansfield RS vs the S&P 500 | +23.92% | Outperform · rising (prior week +1.67, prior month +2.10) |
| MACD / signal / histogram | 0.2737 / 0.1368 / +0.1368 | Golden cross dated 2026-08-12 |
| ADX | 21.91 (2y panel 21.66) | Emerging — trend strength not yet confirmed |
| ATR (14) | $0.27 (4.07% of price) | High relative volatility for position sizing |
| OBV — 2y / 90d | +29.45% / +61.67% vs MA20 | Accumulation, above MA20, rising on both |
| Volume vs 20-day average | 3,278,000 / 1,115,555 = 2.94× | Confirmation volume on the breakout day and the follow-through |
| Stop reference — 1× / 2× ATR | $6.27 / $6.01 | 2× ATR stop sits 8.13% below the close |
① Price & Moving Averages
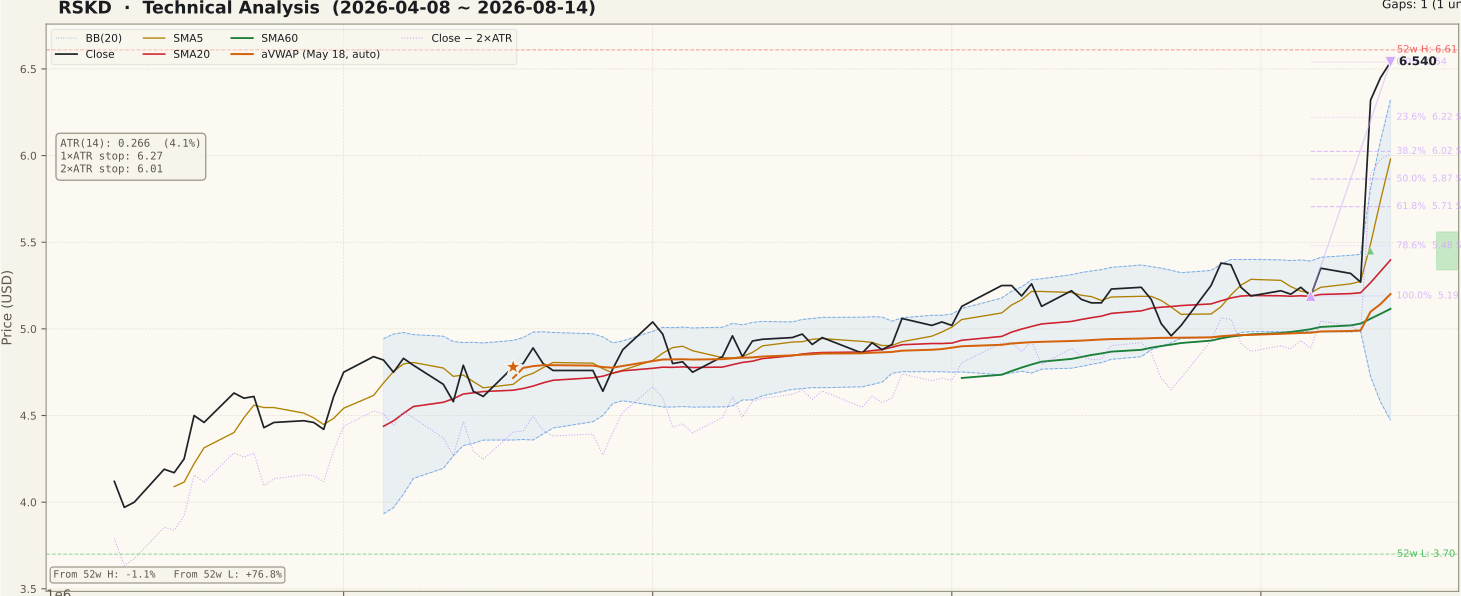
The moving-average stack is textbook bullish: close $6.54 > SMA5 $5.98 > SMA20 $5.40 > SMA60 $5.12, all turning up. What makes this configuration awkward rather than comfortable is the distance: the close sits above the upper Bollinger band at $6.32, roughly a dollar and a sixth above SMA20 and more than a dollar and a third above the 2-year anchored VWAP at $4.78 (anchor 2025-08-18). The 90-day anchored VWAP at $5.20 (anchor 2026-05-18) is now far below price, meaning almost every buyer from the last quarter is in profit — supportive on the way up, but also a reservoir of supply if momentum stalls.
The Fibonacci grid is drawn on the fresh up-swing from $5.19 (2026-08-06) to $6.54 (2026-08-14), so its levels are pullback supports: $6.22 at 23.6%, $6.02 at 38.2%, $5.87 at 50% and $5.71 at 61.8%, with the 100% mark back at the swing origin of $5.19. Below that grid sits the unfilled August 12 gap at $5.34–$5.56, which is the most objective structural line in the chart — gaps of that size act as magnets as often as they act as floors. The 52-week high of $6.61 is the only overhead reference left.
② Volume

Volume is the strongest single argument that this move is real rather than noise. Friday traded 3,278,000 shares against a 20-day average of 1,115,555 — a ratio of 2.94× — and that was the third consecutive expansion day, not an isolated spike. Through late July the same tape was printing sessions of well under a million shares, so the participation shift is large in relative terms. A common beginner error is to treat a breakout as valid on price alone; here the volume confirmation is present, which is why the breakout deserves to be taken seriously.
The caveat is scale. A 20-day baseline near one million shares on a mid-$5 stock is a modest dollar-volume book, so a handful of large orders can move both the price and the volume profile. Spreads and slippage widen quickly in names of this size when a crowd arrives and then leaves. Treat volume readings taken during this window as informative about direction but fragile as a baseline — the 20-day average will itself reset sharply higher over the coming weeks.
③ MACD

MACD registered a golden cross on 2026-08-12 — the same session as the gap — with the MACD line at 0.2737, the signal line at 0.1368 and the histogram at +0.1368. The cross occurred above the zero line, which is the more constructive of the two variants: it says the shorter-term average was already at or above the longer one before the impulse, rather than crossing from deeply negative territory.
The honest reading is that the histogram value equals the entire MACD-minus-signal gap and was built in three sessions. Momentum oscillators of this type are lagging by construction, so a cross created by a single gap tells you the gap happened; it does not tell you the trend has staying power. The useful follow-up is whether the histogram keeps expanding over the next week or begins to contract while price holds — the latter is the classic early sign that an impulse is maturing.
④ RSI

RSI(14) reads 81.50 on the 90-day panel and 81.47 on the 2-year panel — the two agree, and both are far into overbought territory. No RSI divergence is flagged in the data and no divergence peaks are recorded, so there is nothing to read as an early warning here; there is simply an extremely stretched oscillator.
Overbought is not the same as "about to fall." In the early stage of a genuine breakout, RSI routinely pins above 70 for weeks while price walks the upper Bollinger band, and selling purely because the number is high is one of the more expensive habits new traders develop. The practical implication is different: at RSI 81 the odds of entering just before a sharp mean-reversion move are elevated, so the cost of a poorly timed entry is asymmetric. What would change the picture is RSI dropping back through 70 while price simultaneously loses the $6.02 retracement shelf.
⑤ Mansfield Relative Strength

Mansfield RS versus the S&P 500 stands at +23.92%, state outperform, slope rising, and identical on both timeframes as an anchor-free measure should be. The rate of change is the striking part: the prior-week reading was +1.67% and the prior-month reading +2.10%, so the weekly change is +22.26 points and the monthly change +21.83 points. Both place the stock in the positive-and-accelerating quadrant.
That is the profile of a name that was quietly tracking the index for months and then re-rated in a handful of sessions. It is worth being precise about what this measures: RS above zero and rising means the stock is beating the benchmark, not that the move is sustainable. An RS jump of this magnitude created in three sessions is arithmetic driven by one gap, and it will decay mechanically if price simply goes sideways from here. Sustained leadership would look like RS holding in the high teens or better after the current impulse cools.
⑥ ATR & ADX

ATR(14) is $0.27, equal to 4.07% of the closing price — high volatility that has to be respected in position sizing. A single average day now covers roughly a quarter of a dollar, so a stop placed a few cents under a round number will be taken out by ordinary noise. The 1× ATR reference sits at $6.27 and the 2× ATR reference at $6.01, the latter 8.13% below Friday's close.
ADX is 21.91 (2-year panel 21.66), classified as emerging. This is the most important qualifier on the page: ADX measures trend strength, not direction, and a reading in the low twenties says the new trend has not yet earned the "strong" label despite the size of the price move. ADX is slow to respond, so a rising ADX crossing above 25 over the next one to two weeks would be the confirmation that the breakout has become a trend rather than a spike.
⑦ OBV

On-balance volume agrees across both timeframes, which is not always the case. The 2-year panel shows OBV at 47,427,900 against a 20-day average of 36,637,510 — +29.45% above it, state accumulation, slope rising. The 90-day panel shows the same state with a much wider spread: 28,286,400 versus 17,496,010, or +61.67% above its average.
The gap between the two divergence figures is informative. A +61.67% short-term reading against a +29.45% two-year reading means essentially all of the accumulation is recent — this is not a name that was being quietly bought for months before the breakout. That distinction matters, because accumulation built over weeks tends to survive a pullback, while accumulation created in three sessions can unwind just as quickly. Watch whether OBV holds above its 20-day average on the first meaningful down-day; that is the cheapest available test of whether the new buyers intend to stay.
Bull Case vs Bear Case
Bull Case
- Clean break out of a roughly year-long range, with the close at $6.54 only 1.06% under the 52-week high of $6.61.
- Volume confirmation is present: 2.94× the 20-day average on the latest session, after three consecutive expansion days.
- Full bullish moving-average stack — close > SMA5 > SMA20 > SMA60, all rising.
- MACD golden cross on 2026-08-12 occurring above the zero line, with a positive and expanding histogram.
- Mansfield RS at +23.92% versus the S&P 500, positive and accelerating on both weekly and monthly change.
- OBV in accumulation and above its MA20 on both the 90-day (+61.67%) and 2-year (+29.45%) panels.
Bear Case
- RSI at 81.50 is deeply overbought, and the close is outside the upper Bollinger band at $6.32.
- The advance was compressed into three sessions and began with a gap — the entire structure rests on one event.
- ADX at 21.91 is only "emerging"; trend strength has not confirmed the size of the price move.
- An unfilled gap sits below at $5.34–$5.56, a standing downside magnet.
- Price is far above every anchor — SMA20 $5.40, 90-day aVWAP $5.20, 2-year aVWAP $4.78 — so the first support that is not a Fibonacci line is a long way down.
- The catalyst behind the August 12 move is not verifiable from chart data; a news-driven re-rating can retrace as fast as it arrived.
Scenarios
| Scenario | Probability | Path | Trigger / Invalidation |
|---|---|---|---|
| Shallow consolidation, then continuation | 35% | Price digests between $6.22 and $6.61 for several sessions while RSI cools from 81 without price breaking down, then clears the 52-week high. | Trigger: a close above $6.61 on volume at or above the 20-day average, with ADX rising through 25. Invalidation: a close back under $6.02. |
| Retracement into the Fibonacci shelf | 45% | The stretched close reverts toward the $6.02–$6.22 band (38.2%–23.6% of the new swing) or the 50% mark at $5.87, with OBV holding above its MA20. | Trigger: a down-day closing under $6.22. Invalidation of the constructive version: a close under the 61.8% level at $5.71. |
| Failed breakout / gap fill | 20% | Momentum drains, price loses the whole swing and works back toward the unfilled August 12 gap at $5.34–$5.56 and the SMA20 at $5.40. | Trigger: a close under the swing origin of $5.19 after a failed retest. Invalidation: reclaiming $6.02 on expanding volume. |
Key Levels
| Price | Role | Basis |
|---|---|---|
| $6.61 | Resistance | 52-week high — the only overhead reference left |
| $6.54 | Current | Close on 2026-08-14; also the 0% anchor of the current up-swing |
| $6.32 | Reference | Upper Bollinger band — price is currently above it |
| $6.22 | Support | 23.6% retracement of the $5.19 → $6.54 swing |
| $6.02 | Support | 38.2% retracement — first structural shelf |
| $6.01 | 2× ATR stop | Objective invalidation, 8.13% below the close (ATR $0.27) |
| $5.87 | Support | 50% retracement of the current swing |
What to Watch
- Whether volume stays above the 20-day average of 1,115,555 shares as price consolidates — breakouts that lose participation immediately tend to retrace.
- ADX: a move from 21.91 through 25 would upgrade this from "sharp move" to "confirmed trend"; a stall below 20 argues the spike was an event, not a trend.
- The $6.02 shelf (38.2% retracement) — it sits within a cent of the 2× ATR stop at $6.01, making that zone the single cleanest line between a healthy pullback and a failed breakout.
- OBV behaviour on the first real down-day: holding above its MA20 keeps the accumulation reading intact; a break below it would say the recent buyers were transient.
- The unfilled gap at $5.34–$5.56 — if price starts trending toward it, the entire August structure is being unwound.
Conclusion
Past Analyses of This Stock same ticker · newest first
Other signals from this issue same publication date · 7 stocks
This analysis is an educational interpretation of chart data and is not investment advice. Probabilities and levels are subjective estimates; every investment decision, and its outcome, is your own responsibility. This stock shows a recent price shock whose cause cannot be determined from chart data, so technical signals alone are not a sufficient basis for a purchase decision — verify the underlying catalyst independently.
Two Week Swing · twoweekswing.com · 4,600+ stocks screened weekly