Atlassian Corporation
$206.79 −0.28% from 52-week high ($207.37) · +269.2% from 52-week low ($56.01)
This analysis is based on closing-price data as of October 9, 2026. Whether you're researching how to buy Atlassian Corporation stock or you've just opened a brokerage account and are trying to time an entry, here are objective support levels and stop-loss references built from the RSI, MACD and ATR indicators.
On the two-year chart, Atlassian spent most of 2025 and early 2026 in a deep decline, bottoming at its 52-week low of $56.01 in April 2026, then reversed sharply from late July — the close of $206.79 now sits 0.28% under the 52-week high and back inside the zone where the stock traded through mid-2025. Short term, price has pushed to fresh closing highs on Oct 8 and Oct 9 after a late-September pullback to $175.96, MACD crossed back above its signal on Oct 9, and Mansfield RS vs the Nasdaq Composite is +51.4% and rising. The lens for this week is participation: the breakout came on below-average volume (0.71x), and both RSI and OBV show bearish divergence against the early-September peak.
Snapshot as of Oct 9, 2026 close
| Item | Value | Note |
|---|---|---|
| Close | $206.79 | Above the upper Bollinger Band ($206.25) |
| 52-week high / low | $207.37 / $56.01 | −0.28% / +269.2% |
| SMA 5 / 20 / 60 | $199.36 / $191.28 / $160.39 | Bullish stack: Close > 5 > 20 > 60 |
| Bollinger (20) | $206.25 / $191.28 / $176.31 | Band width 15.65% |
| aVWAP 90d (anchor Aug 7) | $175.38 | Short-term; price +17.9% above |
| aVWAP 2y (anchor May 1) | $118.42 | Long-term; price far above |
| RSI (14) | 66.24 | Bearish divergence vs Sep 3 (80.29) |
| Mansfield RS vs Nasdaq Composite | +51.45% | Outperform, rising (prev week +38.88, prev month +36.50) |
| MACD / Signal / Hist | 7.23 / 6.79 / +0.44 | Golden cross Oct 9 (above zero) |
| ADX (14) | 25.86 (90d) / 25.49 (2y) | Strong, but well off its September level |
| ATR (14) | $8.57 | 4.14% of price |
| OBV 2y / 90d | Early accumulation, flat / Early accumulation, flat | Above MA20 by 3.63% / 4.32%; bearish divergence on both |
| Volume vs 20-day avg | 0.71x | 2.10M vs 2.95M average |
| 1× / 2× ATR stop | $198.22 / $189.66 | −4.14% / −8.28% from close |
① Price & Moving Averages
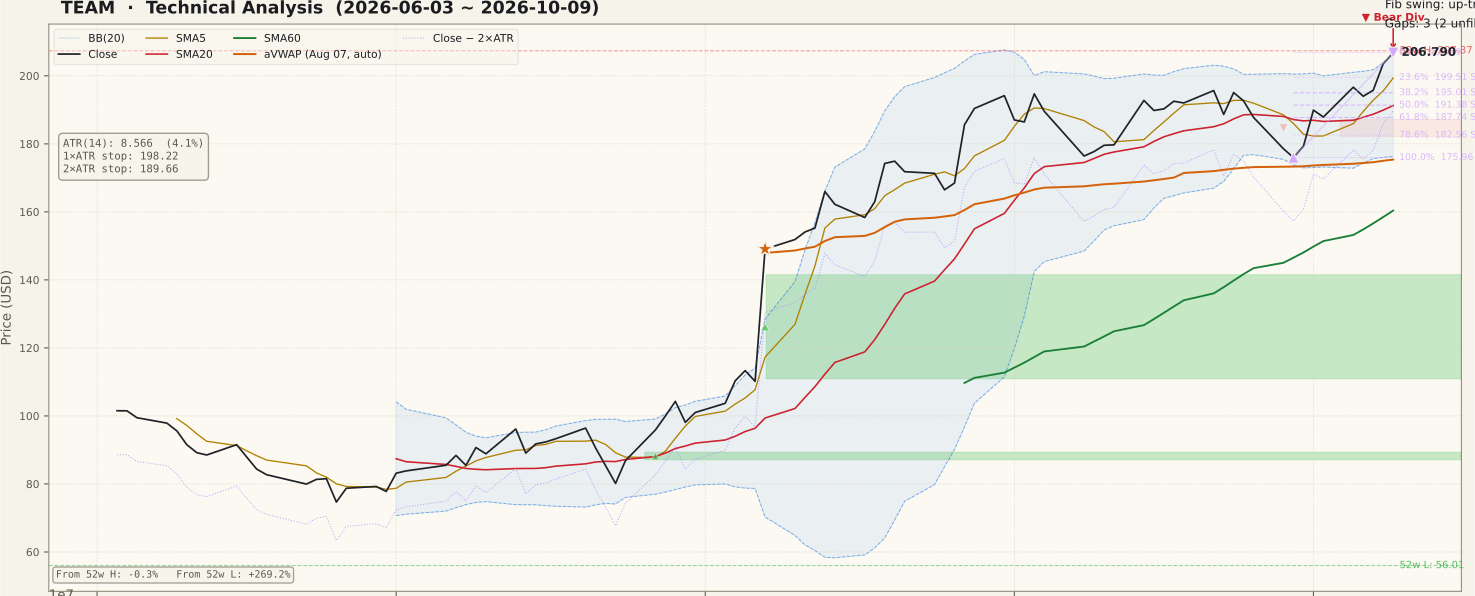
The moving averages are in a clean bullish stack — close $206.79 > SMA5 $199.36 > SMA20 $191.28 > SMA60 $160.39 — and the SMA60 is still climbing steeply, a reflection of how far the stock has travelled since late July. The close is 8.1% above the SMA20 and has poked just above the upper Bollinger Band ($206.25), which in a trend can mean band-walking but also leaves little cushion if the move stalls. The most recent upswing runs from the Sep 29 low of $175.96 to Friday's close; on that swing the 23.6% retracement is $199.51, 38.2% is $195.01 and 50% is $191.38, which overlaps the SMA20 and Bollinger midline. The 90-day anchored VWAP from the Aug 7 gap day sits at $175.38, almost exactly the late-September low, so the buyers from that session are comfortably in profit. Historically, the advance was built on a few large up days — most notably the Aug 7 session, which left an unfilled gap between $110.88 and $141.51 far below current price — but those are two months old and outside this week's window.
② Volume

Friday's volume was 2.10M shares against a 20-day average of 2.95M — a ratio of 0.71x. The volume bars through the whole October push are mostly at or below the average line, so this breakout to new closing highs has not been confirmed by heavier participation. Context matters here: it was a quiet week across the U.S. market, with the median stock in our screening universe trading at roughly 0.68x–0.94x of its own average each day, so TEAM's 0.71x on Friday is roughly in line with the tape rather than unusually weak. Still, "in line with a quiet market" is not the same as "confirmed" — a breakout on below-average volume is the classic case where follow-through needs to be watched rather than assumed. The 20-day average itself has drifted lower since the heavy August sessions, so the next push above $207 on a ratio above 1.0x would carry more weight.
③ MACD

MACD (7.23) crossed back above its signal line (6.79) on Oct 9, turning the histogram positive at +0.44 after roughly a month of negative bars. This is a golden cross well above the zero line, so it reads as a resumption of an existing uptrend rather than an early-stage reversal. Note the shape, though: MACD peaked near 20 in late August and has spent September and early October unwinding that extreme, so the line is still far below its high even as price makes a new one. A thin histogram right after a cross is fragile — a few soft sessions could flip it back.
④ RSI

RSI stands at 66.24, below the 70 overbought line after a dip toward 50 in late September. The chart flags a regular bearish divergence: on Sep 3 price closed at $194.68 with RSI at 80.29, while on Oct 9 price closed higher at $206.79 with RSI only 66.24. That means the new high came with less momentum than the prior peak. A divergence is a possibility of a top, not a confirmed one — it is only acted on by the chart if price subsequently fails, for example by losing the 38.2% retracement near $195. On the constructive side, RSI holding in the 60s rather than being pinned above 80 also leaves room for a further leg without an extreme reading.
⑤ Mansfield RS vs the Nasdaq Composite

Mansfield RS vs the Nasdaq Composite is +51.45%, in outperform territory and rising. One week ago it was +38.88 and one month ago +36.50, so the weekly change is +12.57 and the monthly change +14.95 — both positive, which puts TEAM in the "positive and accelerating" quadrant. On the two-year view this is a dramatic turnaround: RS spent from mid-2025 into July 2026 deep in negative territory before crossing above zero in August. Relative strength is the strongest single argument in this chart; it says the stock has been leading the index, not just rising with it.
⑥ ATR · ADX

ATR(14) is $8.57, or 4.14% of price — a wide daily range that has stayed elevated since the August jump and has eased only slightly in October. That puts the 1× ATR reference at $198.22 and the 2× ATR stop at $189.66, about 8.3% below the close; position size should be scaled to that distance rather than to a tighter level that normal noise could reach. ADX is 25.86 on the 90-day chart (25.49 on the 2-year), still in the "strong" zone, but the line has been sliding steadily from its September level, so trend strength has been fading while price consolidated. A rising ADX from here would confirm that the October breakout is restarting the trend rather than extending a range.
⑦ OBV

OBV is tagged "early accumulation" on both timeframes — above its 20-day average by 4.32% on the 90-day chart and 3.63% on the 2-year chart — but its slope is flat on both. Both timeframes also flag a bearish OBV divergence: on the 90-day series OBV was 60.83M at the Sep 3 peak ($194.68) and is 58.55M at the Oct 9 high ($206.79), i.e., price made a higher high while OBV made a lower one (the 2-year series shows the same pattern, from −62.22M to −64.50M). This agrees with the RSI divergence and with the below-average volume: the latest leg up has had less net buying behind it than the early-September push. On the longer view, OBV has recovered a large share of its 2026 drawdown but remains below its 2025 levels, so long-term accumulation is still a work in progress.
Bull vs Bear
Bull Case
- Fresh closing highs on Oct 8 and Oct 9; close within 0.28% of the 52-week high.
- Moving averages fully stacked (Close > SMA5 > SMA20 > SMA60), SMA60 rising steeply.
- Mansfield RS +51.45% vs the Nasdaq Composite and accelerating week-over-week and month-over-month.
- MACD golden cross on Oct 9, above the zero line — a trend-resumption cross.
- The Sep 29 pullback held at $175.96, right at the 90-day aVWAP ($175.38), and was bought.
- ADX still above 25 and OBV above its 20-day average on both timeframes.
Bear Case
- Breakout on below-average volume (0.71x); no session in October cleared the 20-day average meaningfully.
- Bearish RSI divergence: higher price, lower RSI (80.29 on Sep 3 vs 66.24 now).
- Bearish OBV divergence on both timeframes; OBV slope flat.
- Close above the upper Bollinger Band and 8.1% above the SMA20 — stretched short term.
- ADX drifting lower from its September level; trend strength fading.
- On the 2-year chart, price is re-entering the zone where it traded through mid-2025, a potential area of overhead supply.
Scenarios
| Scenario | Probability | Path | Trigger / Invalidation |
|---|---|---|---|
| Continuation | 40% | Holds above the 23.6% retracement ($199.51) and extends beyond the 52-week high ($207.37). | Trigger: daily close above $207.37 with volume above 1.0x average. Invalidation: close back below $199.51. |
| Pullback / digestion | 40% | Divergences resolve sideways; price retests $195.01 (38.2%) or the $191 area (SMA20 / 50% retracement). | Trigger: failure to hold above $199.51. Invalidation: daily close below the 2× ATR stop at $189.66. |
| Failed breakout | 20% | The low-volume push fails; price drops through the SMA20 toward the Sep 29 low ($175.96) and 90-day aVWAP ($175.38). | Trigger: close below $189.66. Invalidation: recovery back above $199.51. |
Key Levels
| Price | Role | Basis |
|---|---|---|
| $207.37 | Resistance | 52-week high |
| $206.79 | Current | Oct 9 close |
| $199.51 | Support | 23.6% retracement of the Sep 29 – Oct 9 swing; near SMA5 ($199.36) |
| $195.01 | Support | 38.2% retracement |
| $191.28 | Support | SMA20 / Bollinger midline; 50% retracement $191.38 |
| $189.66 | Stop (2× ATR) | Close − 2 × ATR ($8.57) |
| $175.96 | Support | Sep 29 swing low; 90-day aVWAP $175.38 |
What to Watch
- Volume on the next attempt above $207.37 — a ratio above 1.0x would answer the participation question this breakout leaves open.
- Whether RSI can make a new high alongside price; a further lower RSI high would deepen the divergence.
- OBV slope turning up from flat, which would neutralize the OBV divergence.
- Holding $199.51 / $195.01 on any pullback; a close below the SMA20 near $191 weakens the short-term structure.
- ADX turning back up above its current level to confirm a renewed trend.
Conclusion
Past Analyses of This Stock same ticker · newest first
Other signals from this issue same publication date · 5 stocks
This analysis is an educational interpretation of chart data and is not investment advice. Probabilities and levels are subjective estimates; every investment decision, and its outcome, is your own responsibility.
Two Week Swing · twoweekswing.com · 4,600+ stocks screened weekly