PagerDuty, Inc.
$16.16 −3.6% from the 52-week high of $16.77
This analysis is based on closing-price data as of October 9, 2026. Whether you're researching how to buy PagerDuty, Inc. stock or you've just opened a brokerage account and are trying to time an entry, here are objective support levels and stop-loss references built from the RSI, MACD and ATR indicators.
PagerDuty spent most of 2025 drifting lower, broke down hard in late November 2025 and bottomed at the $5.70 52-week low in April 2026; since a gap higher on May 29 it has climbed in a steady staircase and the October 9 close of $16.16 is 183.5% above that low. Mansfield relative strength is +36.9% vs the S&P 500 and still accelerating, and ADX near 40 says the trend is strong. The short-term signal is a fresh 20-day closing high on an ordinary-volume session, but price now sits just outside the upper Bollinger Band, RSI shows a bearish divergence against the late-August peak, and the stock is back in the October–November 2025 zone where it traded before last year's breakdown — so this page reads the setup as a mature, strong trend testing old overhead supply rather than a fresh launch.
Snapshot all figures from the chart JSON · as of October 9, 2026
| Close | $16.16 |
|---|---|
| 52-week high / low | $16.77 (−3.6%) / $5.70 (+183.5%) |
| SMA5 / SMA20 / SMA60 | $15.67 / $14.96 / $12.85 — close > SMA5 > SMA20 > SMA60, bullish alignment |
| Bollinger (20) | Upper $16.10 · Mid $14.96 · Lower $13.82 · width 15.27% — close slightly above the upper band |
| aVWAP — 90d | $14.52 (anchor Aug 28, 2026) — price above |
| aVWAP — 2y | $9.52 (anchor Nov 26, 2025) — price above |
| RSI (14) | 70.6 (2y) / 70.7 (90d) — just above 70 · bearish divergence flagged (2y and 90d) |
| Mansfield RS | +36.9% vs the S&P 500 · outperform · slope rising · prior week 30.82 · prior month 18.72 |
| MACD (12,26,9) | MACD 0.678 · Signal 0.657 · Histogram +0.021 (2y) · golden cross Oct 9, 2026, well above zero |
| ADX (14) | 39.9 (2y) / 40.1 (90d) — strong trend (direction-neutral) |
| ATR (14) | $0.55 — 3.4% of price |
| OBV — 2y / 90d | 2y: early accumulation, above MA20, slope flat (spread 8.37%) · 90d: accumulation, above MA20, slope rising (spread 62.59%) · no OBV divergence flagged in either frame |
| Volume | 1,550,300 shares — 0.89× the 20-day average of 1,737,700 (about 1.3× after adjusting for a quiet 0.68× market session) |
| Stop references | 1×ATR $15.61 (−3.4%) · 2×ATR $15.05 (−6.9%) |
① Price & Moving Averages
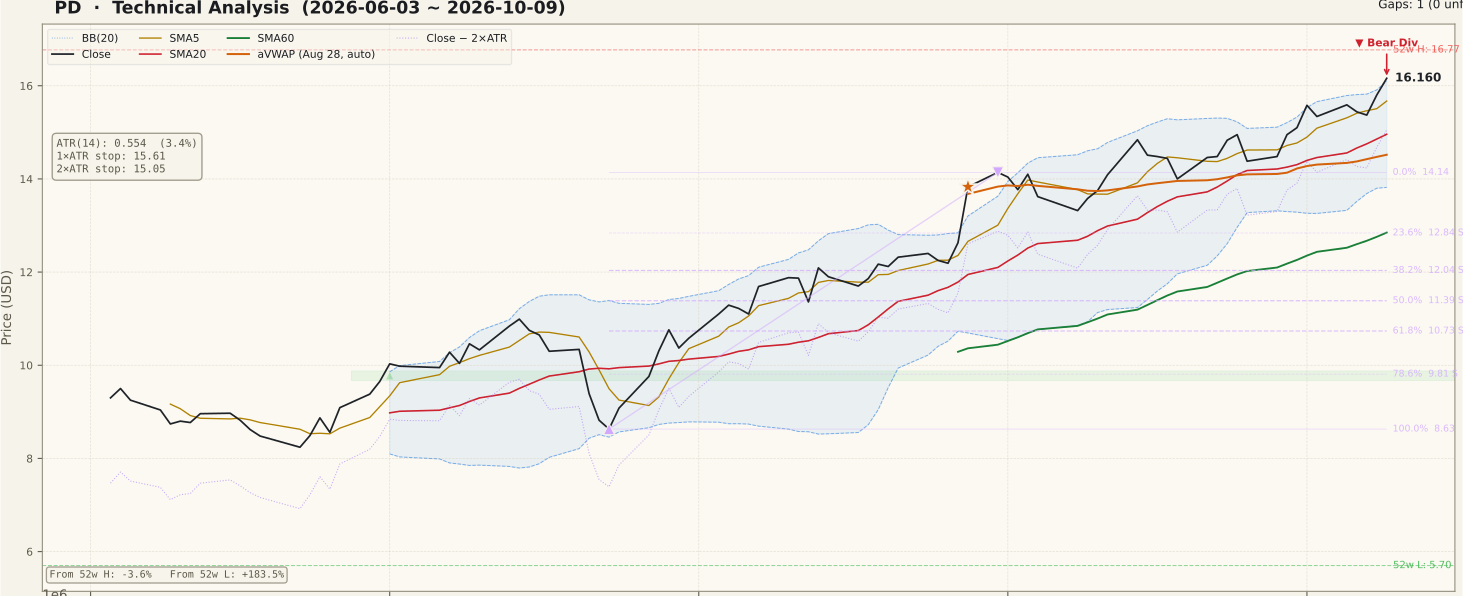
The two-year chart has three phases: a slow grind lower through 2025 with a long sideways stretch in the mid-teens, a sharp break in late November 2025 (the anchor of the 2-year aVWAP at $9.52) that carried into the April 2026 low of $5.70, and a recovery that began with the May 29 gap. That gap is still unfilled on the 2-year chart between $7.66 and $8.69. Since late July the stock has stair-stepped higher in an orderly way: the close, SMA5 ($15.67), SMA20 ($14.96) and SMA60 ($12.85) are stacked in bullish order, and the stacking has held without interruption since the end of July.
The measured Fibonacci swing runs from the July 23 low of $8.63 to the August 31 high of $14.14. Price has already climbed past the top of that swing, so its retracement levels ($12.84 at 23.6%, $12.04 at 38.2%, $11.39 at 50%) are now well below and only matter in a deep pullback; the $14.14 swing high itself is now a level underneath price rather than overhead. The more relevant reference overhead is the $16.77 52-week high, which was set in October 2025 at the start of the zone where the stock traded before the November breakdown. The close also sits slightly above the upper Bollinger Band ($16.10): in a strong trend price can ride the band, but closes outside it often pause or pull back to the middle band ($14.96).
② Volume

October 9 volume was 1,550,300 shares, 0.89× the 20-day average of 1,737,700. On its own that is below-average participation for a breakout close, which normally calls for caution. The market context matters here, though: the median stock in our screening universe traded only about 0.68× its own average that day, so relative to a quiet tape PD's volume was roughly 1.3× normal — firm, but not emphatic.
The larger picture is that volume has been unremarkable for most of this advance. The 90-day panel shows a few spikes — the late-August jump that anchors the 90-day aVWAP, and isolated heavy sessions in mid- and late September — but the climb itself has been built on average-sized days. That reads as steady demand rather than a crowded chase, but it also means this breakout has not been confirmed by a clear surge.
③ MACD

MACD (0.678) crossed back above its signal line (0.657) on October 9, leaving a small positive histogram of +0.021. Both lines sit well above zero, which is consistent with an established uptrend rather than an early turn. The detail worth noticing in the 90-day panel is that the two lines have been running almost on top of each other since mid-September, swapping places several times with only tiny histogram bars.
That flattening means momentum has stopped building even as price kept rising — the MACD peak was in early September, and the October rally has not pushed it higher. A golden cross this close to the signal line is a weak confirmation; a widening positive histogram over the next sessions would carry more weight than the cross itself.
④ RSI

RSI closed at 70.6 (2y) / 70.7 (90d), just across the 70 line. More important is the bearish divergence flagged in both frames: on August 31 price closed at $14.14 with RSI at 77.11 (2y; 77.29 on the 90d series), while on October 9 price closed higher at $16.16 with RSI lower at 70.65 (70.66 on the 90d). Higher price, lower momentum peak.
A divergence is a warning, not a top call — strong trends frequently carry RSI divergences for weeks before resolving either way, and RSI has held above 50 throughout this advance. It would only become meaningful if price failed and RSI dropped back below the mid-50s; until then it simply says the October push is less forceful than the late-August thrust.
⑤ Mansfield Relative Strength

PD is an NYSE listing, so relative strength is measured vs the S&P 500. Mansfield RS is +36.9% with a rising slope. One week ago it was 30.82 and one month ago 18.72, so it has gained about 6.1 points in a week and about 18.2 points in a month — positive and accelerating.
The two-year panel shows how unusual this is for PD: the line spent essentially all of 2025 and the first half of 2026 below zero, bottoming around −60 in the spring, and only crossed into positive territory in late August. It is now at the highest reading on the two-year chart. This is the strongest argument in the setup — the stock is not just rising with the market, it is clearly outrunning it.
⑥ ATR · ADX

ATR is $0.55, or 3.4% of price, and has been drifting lower through the 90-day window — daily swings are getting narrower as the stock rises, which is typical of an orderly trend. The resulting stop references are $15.61 at 1×ATR (−3.4%) and $15.05 at 2×ATR (−6.9%).
ADX reads 39.9 (2y) / 40.1 (90d), firmly in strong-trend territory and edging up. ADX measures trend strength, not direction; here the direction is clearly up, so the reading confirms a well-established advance. The flip side is that ADX near 40 after a months-long run is a mature reading — the trend is not new, and late-stage trends tend to produce sharper shakeouts.
⑦ OBV

The two frames tell different stories. On the 90-day view OBV is in accumulation — above its 20-day average with a rising slope, and 62.59% above that average (a spread measure, not a divergence) — and it has been making higher highs alongside price since late August.
On the two-year view the state is only early accumulation: OBV is above its MA20 (spread 8.37%) but the slope is flat, and the line remains far below where it stood before the late-2025 and early-2026 selling. In other words, the recent buying is real but has only recovered a small part of the volume that left during the decline. No OBV divergence is flagged in either frame.
Bull Case vs Bear Case
Bull Case
- Close > SMA5 > SMA20 > SMA60, stacked without a break since the end of July.
- Mansfield RS +36.9% vs the S&P 500, the highest on the two-year chart and still accelerating.
- ADX near 40 in both frames — a strong, well-defined uptrend.
- New 20-day closing high with no company-specific event in the last five sessions.
- Price above both anchored VWAPs ($14.52 short-term, $9.52 long-term).
- 90-day OBV in accumulation with a rising slope; no OBV divergence.
Bear Case
- Bearish RSI divergence: RSI 70.65 now vs 77.11 at the August 31 peak while price is higher.
- Close slightly above the upper Bollinger Band — stretched in the short term.
- MACD flat since mid-September; the October 9 golden cross is marginal.
- Breakout-day volume 0.89× average (about 1.3× only after market adjustment).
- Back in the October–November 2025 trading zone, with the $16.77 52-week high just overhead.
- Mature trend: price is far above SMA60 ($12.85) and the 2-year OBV has only partly recovered.
Scenarios
| Scenario | Probability | Path | Trigger / Invalidation |
|---|---|---|---|
| Trend extension | 35% | Price works through the old 2025 trading zone and clears the $16.77 52-week high, with RSI holding above 60. | Trigger: close above $16.77 on above-average volume. Invalidation: close back below $15.05 (2×ATR). |
| Pause / pullback within trend | 45% | The stretch above the upper band unwinds; price consolidates or dips toward SMA20 / the middle band near $14.96 and the 90-day aVWAP at $14.52 while the moving-average stack stays intact. | Holds if SMA20 keeps rising and closes stay above $14.52; fails if that zone breaks. |
| Failed breakout | 20% | The RSI divergence resolves lower; price drops back under the 90-day aVWAP toward the $14.14 August swing high and possibly SMA60. | Trigger: close below $14.52 with MACD turning negative on the histogram. Invalidation: reclaim of $16.16. |
Key Levels
| Price | Role | Basis |
|---|---|---|
| $16.77 | Resistance | 52-week high (October 2025) |
| $16.16 | Current | October 9 close |
| $15.67 | Support | SMA5 |
| $15.05 | Stop reference | 2×ATR stop (−6.9%) |
| $14.96 | Support | SMA20 / Bollinger middle band |
| $14.52 | Support | 90-day anchored VWAP (anchor Aug 28) |
| $14.14 | Support | August 31 swing high (top of the measured Fibonacci swing) |
What to Watch
- Whether price can close above the $16.77 52-week high — and on what volume.
- Whether RSI can make a new high above the August reading; a drop back toward 55 would give the divergence teeth.
- The MACD histogram: a widening positive bar confirms the October 9 cross, a quick flip back negative does not.
- How a pullback behaves around SMA20 ($14.96) and the 90-day aVWAP ($14.52).
- Mansfield RS: a continued rise keeps the leadership case intact; a roll-over while price stalls would be an early warning.
Conclusion
Past Analyses of This Stock same ticker · newest first
Other signals from this issue same publication date · 5 stocks
This analysis is an educational interpretation of chart data and is not investment advice. Probabilities and levels are subjective estimates; every investment decision, and its outcome, is your own responsibility. All figures are derived from closing-price data through October 9, 2026 and are not updated after publication.
Two Week Swing · twoweekswing.com · 4,600+ stocks screened weekly