Marvell Technology, Inc.
$275.28 −16.6% from the 52-week high of $329.88 · +289.4% from the 52-week low of $70.69
This analysis is based on closing-price data as of October 9, 2026. Whether you're researching how to buy Marvell Technology, Inc. stock or you've just opened a brokerage account and are trying to time an entry, here are objective support levels and stop-loss references built from the RSI, MACD and ATR indicators.
Over two years Marvell went from a 2025 slump to a near-vertical spring 2026 advance that set a $329.88 intraday 52-week high, then gave back a large part of it into a late-July low before rebuilding. Since mid-September the stock has been in a fully stacked uptrend (close > SMA5 > SMA20 > SMA60), and Mansfield relative strength is +63.6% vs the Nasdaq Composite. The October 6 Investor Day lifted the stock 5.81% to a $287.01 close on heavy volume; the two sessions after it pulled the price back to $275.28. This page reads the setup as a trend pullback inside an uptrend that predates the event by about three weeks — with the open question being whether the pullback holds above the rising SMA20.
Snapshot all figures from the chart JSON · as of October 9, 2026
| Close | $275.28 |
|---|---|
| 52-week high / low | $329.88 (−16.6%) / $70.69 (+289.4%) |
| SMA5 / SMA20 / SMA60 | $278.58 / $258.47 / $229.02 — SMA5 > SMA20 > SMA60, bullish alignment; close just under SMA5 |
| Bollinger (20) | Upper $296.57 · Mid $258.47 · Lower $220.37 · width 29.48% |
| aVWAP — 90d | $245.55 (anchor Aug 28, 2026) — price above |
| aVWAP — 2y | $171.75 (anchor Aug 29, 2025) — price above |
| RSI (14) | 61.4 (90d) / 61.5 (2y) — above 50, below 70 · no RSI divergence flagged |
| Mansfield RS | +63.6% vs the Nasdaq Composite · outperform · slope rising · prior week 66.26 · prior month 58.31 |
| MACD (12,26,9) | MACD 12.85 · Signal 11.73 · Histogram +1.12 (90d) · golden cross Sep 16, 2026, above zero |
| ADX (14) | 26.1 (2y) / 26.2 (90d) — strong trend (>25, direction-neutral) |
| ATR (14) | $14.61 — 5.3% of price |
| OBV — 2y / 90d | 2y: early accumulation, above MA20, slope flat (spread vs own MA20 3.65%) · 90d: accumulation, above MA20, slope rising (spread 20.46%) · no OBV divergence flagged in either frame |
| Volume | 15,047,300 shares — 0.77× the 20-day average of 19,501,605 (about 1.13× after adjusting for a quiet 0.68× market session) |
| Stop references | 1×ATR $260.67 (−5.3%) · 2×ATR $246.06 (−10.6%) |
① Price & Moving Averages
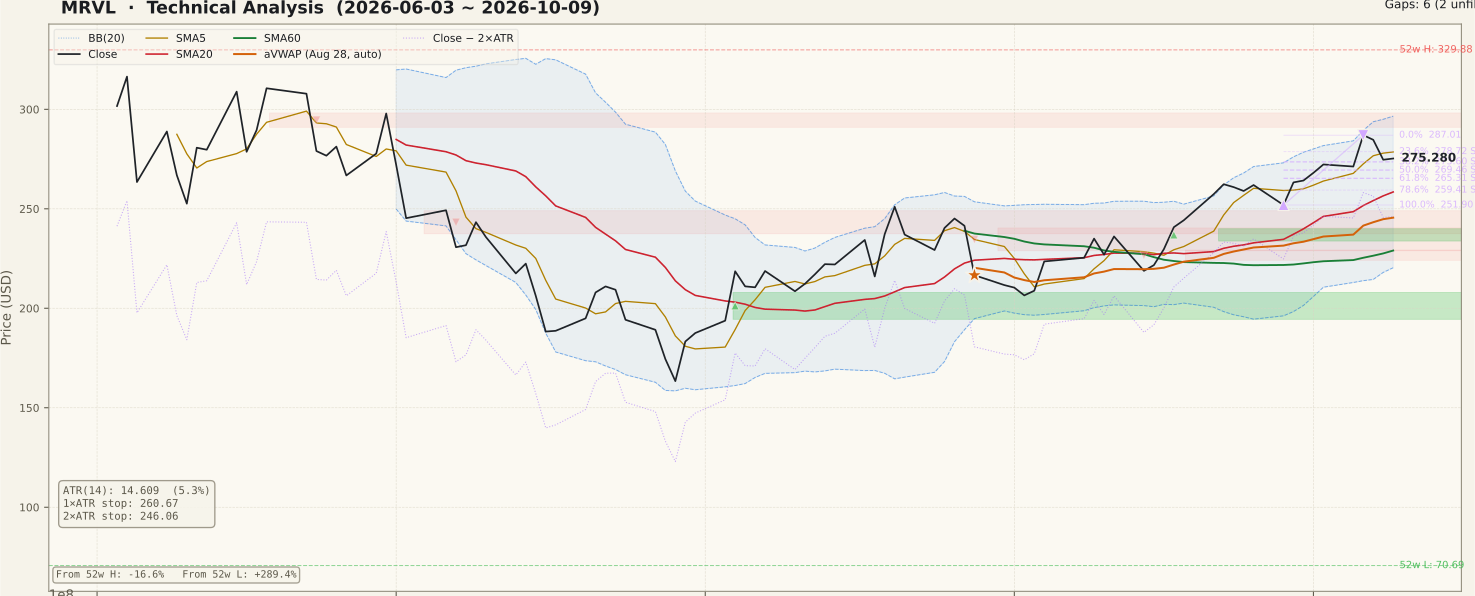
The two-year chart has a clear shape: a slide through early 2025, a long sideways base in the $60–$100 area, and then a steep advance from March 2026 into a June peak (the closing high of the swing was $316.43 on June 4; the intraday 52-week high is $329.88). From there the stock lost roughly half its gain into a late-July low, recovered through August, dropped 10.3% on August 28, and has been rebuilding since early September. The October 9 close of $275.28 sits 16.6% below the 52-week high.
The moving averages are stacked: SMA5 $278.58 above SMA20 $258.47 above SMA60 $229.02. That full order has been in place continuously since September 17 (17 sessions), and the close has stayed above both SMA20 and SMA60 since September 16 — so the trend was established about three weeks before the October 6 Investor Day. The 90-day swing runs from a $251.90 close on September 28 to a $287.01 close on October 6; the October 9 close sits between that swing's 23.6% retracement ($278.72) and its 38.2% retracement ($273.60), and just under SMA5. In other words, the stock has given back roughly a third of the last leg. Both anchored VWAPs are below — $245.55 on the 90-day frame (anchored at the August 28 drop) and $171.75 on the two-year frame — and the Bollinger mid-band coincides with SMA20 at $258.47.
② Volume

Base-date volume was 15,047,300 shares, 0.77× the 20-day average of 19,501,605. October 9 was a quiet session for the market as a whole — the median stock in our universe traded at about 0.68× its own 20-day average — so on a market-adjusted basis MRVL's participation was closer to 1.13×, roughly normal.
The standout bar of the past month is October 6, the Investor Day session, at about 2.97× the prior 20-day average while the market median that day was near 0.74× — an unusually heavy day in a quiet tape. The pullback that followed came on lighter but still above-average volume (about 1.27× on October 7 and about 1.54× on the −3.52% October 8 session), then faded to below-average on October 9. Selling after the event was therefore real but not heavier than the buying that preceded it. The September rebuild itself ran mostly on below-average volume, which is a reminder that the trend before the event was a steady climb rather than a volume-driven breakout.
③ MACD

MACD (12.85) is above its signal line (11.73) with a histogram of +1.12; the last cross was a golden cross on September 16, and both lines are well above zero. This is a trend-continuation configuration: MACD bottomed deep below zero in late July, crossed up in early August, and has been climbing through September and early October.
The histogram has narrowed over the last few sessions as the pullback pulled MACD back toward its signal line. That is normal behaviour in a pullback, but it is the indicator to watch: a histogram that stabilises and widens again would mark the pullback as a pause, while a cross below the signal line would mean momentum has rolled over from the Investor Day peak.
④ RSI

RSI stands at 61.4 on the 90-day frame (61.5 on the two-year frame) — above the 50 midline and below the 70 overbought line. On the panel, RSI touched the 70 area around the October 6 session and has eased back since, which is the shape of a pullback cooling an overextension rather than a momentum breakdown.
Neither frame flags an RSI divergence. Through September RSI held a gently rising band above 50, so the momentum picture behind the trend is orderly. A drop under 50 would be the first sign that the pullback is turning into something deeper.
⑤ Mansfield Relative Strength

Mansfield RS is +63.6% vs the Nasdaq Composite, tagged outperform with a rising slope, and it reads the same in both frames. Against the prior readings the picture is mixed in timing: it is positive and slowing week over week (down 2.65 points from last week's 66.26, as the pullback trimmed the lead) but positive and accelerating month over month (up 5.31 points from last month's 58.31).
The two-year panel puts this in context: RS crossed above zero in March 2026, spiked above 150 at the June peak, and then settled into a roughly 40–70 band from August onward. The stock has not lost its lead over the benchmark at any point since spring, even through the summer drawdown. That durability is a large part of why MRVL appears in this week's trend-pullback screen (RS rank 96).
⑥ ATR & ADX

ATR is $14.61, or 5.3% of price. It has fallen a long way from the June peak period, but it ticked up again with the Investor Day session and the pullback. That sets the objective stop references at $260.67 (1×ATR, −5.3%) and $246.06 (2×ATR, −10.6%). The 2×ATR level sits a little above the 90-day anchored VWAP ($245.55) and well below SMA20 ($258.47), so a close there would mean the September trend structure has broken, not just that the pullback ran long.
ADX is 26.1 on the two-year frame and 26.2 on the 90-day frame — above 25, the "strong trend" zone, and rising gently from the low-20s it held in September. ADX measures strength, not direction; here, with the averages stacked upward, it says the up-trend has gained traction rather than drifting.
⑦ OBV

The two frames read differently. On the 90-day frame OBV is tagged accumulation — above its 20-day average with a rising slope, and 20.46% above that average. On the two-year frame it is early accumulation — above its average but flat, with a 3.65% spread. Those spreads measure how far OBV sits above its own MA20; they are not divergence readings. Neither frame flags an OBV divergence.
On the 90-day panel OBV climbed through late September, jumped on the Investor Day volume, and has dipped only modestly in the two down sessions after it, staying well above its average. Cumulative volume is therefore broadly keeping pace with price. The flat two-year reading is the caveat: on the longer view OBV has been holding a plateau since the summer rather than making clear new progress.
Bull vs Bear
Bull Case
- Full SMA5 > SMA20 > SMA60 alignment since September 17 — about three weeks before the Investor Day.
- Mansfield RS +63.6% vs the Nasdaq Composite; positive since March 2026 and up 5.31 pts over the month.
- MACD above its signal (golden cross Sep 16) and well above zero.
- ADX 26.2 — the trend has strength, not just direction.
- OBV in accumulation on the 90-day frame (rising, 20.46% above its MA20); no RSI or OBV divergence.
- Price above both anchored VWAPs ($245.55 90d, $171.75 2y); pullback volume lighter than the event-day buying.
Bear Case
- The latest leg up peaked on the October 6 Investor Day session; part of the recent strength is event-driven.
- Two of the three sessions since were down, including −3.52% on October 8 at about 1.54× volume.
- RS slowing week over week (−2.65 pts) and the MACD histogram narrowing.
- Still 16.6% below the $329.88 52-week high, with the June supply zone overhead.
- ATR at 5.3% of price makes the 2×ATR reference a wide −10.6% from the close.
- OBV flat on the two-year frame; the August 28 −10.3% bar shows how fast this stock can drop.
Scenarios
| Scenario | Probability | Path | Trigger / Invalidation |
|---|---|---|---|
| Pullback holds, trend resumes | 40% | The dip stabilises in the $269–$274 retracement zone and price works back toward the $287.01 Investor Day close. | Trigger: close back above SMA5 ($278.58) with the MACD histogram widening again. Invalidation: close below SMA20 $258.47. |
| Deeper pullback to SMA20 | 35% | The post-event giveback extends to the rising SMA20 / Bollinger mid-band near $258.47 before the trend reasserts. | Holds above SMA20 on a closing basis; RSI stays above 50; MACD stays above its signal. |
| Trend breaks | 25% | The event high marks a top for the leg and price falls back toward the September 17 gap and the 90-day anchored VWAP. | Close below the 2×ATR stop $246.06; MACD crosses below its signal. |
Key Levels
| Price | Role | Basis |
|---|---|---|
| $296.57 | Resistance | Upper Bollinger Band |
| $287.01 | Resistance | Oct 6 close (Investor Day) · 0% of the Sep 28 → Oct 6 swing |
| $275.28 | Current | Close of Oct 9, 2026 · just under SMA5 $278.58 |
| $273.60 | Support | 38.2% retracement of the $251.90 → $287.01 swing |
| $269.46 | Support | 50% retracement of the same swing |
| $258.47 | Support | SMA20 / Bollinger mid-band |
| $246.06 | Stop (2×ATR) | Objective invalidation, −10.6% from the close |
Deeper references: the 90-day anchored VWAP at $245.55 sits just under the 2×ATR stop; an unfilled support gap remains at $233.77–$240.00 (September 17, 2026), SMA60 is $229.02, and a larger unfilled gap sits at $194.44–$208.00 (August 4, 2026). The 23.6% retracement of the recent swing ($278.72) is now above the close, so it acts as a level to reclaim rather than support.
What to Watch
- A close back above SMA5 ($278.58). Reclaiming it would show the post-Investor Day pullback is ending.
- SMA20 at $258.47. The rising 20-day average has been the trend's floor since mid-September; a close below it changes the read from pullback to correction.
- The MACD histogram. Widening again supports a pause; a cross below the signal line means momentum has rolled over from the event peak.
- Volume on down days. Further declines on volume above the 19,501,605 average would suggest the event-day buyers are leaving.
- The 2×ATR stop at $246.06. A close below breaks the September trend structure.
Conclusion
Past Analyses of This Stock same ticker · newest first
Other signals from this issue same publication date · 5 stocks
This analysis is an educational interpretation of chart data and is not investment advice. Probabilities and levels are subjective estimates; every investment decision, and its outcome, is your own responsibility. All figures are derived from closing-price data through October 9, 2026 and are not updated after publication.
Two Week Swing · twoweekswing.com · 4,600+ stocks screened weekly