Reinsurance Group of America, Incorporated
$255.98 −1.0% from the 52-week high of $258.53 · +43.6% from the 52-week low of $178.21
This analysis is based on closing-price data as of October 9, 2026. Whether you're researching how to buy Reinsurance Group of America, Incorporated stock or you've just opened a brokerage account and are trying to time an entry, here are objective support levels and stop-loss references built from the RSI, MACD and ATR indicators.
After spending most of 2025 in a $180–$210 range and lagging the market, RGA broke higher in July 2026 and has since built a five-week shelf roughly between $244 and $256. The October 9 close of $255.98 is the highest close of the past year, sits right at the upper Bollinger band and is only 1.0% under the $258.53 intraday 52-week high set on October 8. Mansfield RS of +9.49% vs the S&P 500 keeps the stock on the outperforming side, and the SMA5 > SMA20 > SMA60 stack re-formed on September 29. The lens for this page is a trend pullback that has resolved back to the top of its range: the structure is constructive, but ADX at 13.7 says the trend is not strong, and the range top has not yet been cleared.
Snapshot all figures from the chart JSON · as of October 9, 2026
| Close | $255.98 |
|---|---|
| 52-week high / low | $258.53 (−1.0%) / $178.21 (+43.6%) |
| SMA5 / SMA20 / SMA60 | $253.12 / $249.03 / $245.30 — close > SMA5 > SMA20 > SMA60, bullish alignment |
| Bollinger Bands (20) | Upper $256.07 · Mid $249.03 · Lower $241.98 · width 5.66% (narrow) — close at the upper band |
| Anchored VWAP | 90-day: $247.96 (anchor Aug 7, 2026) · 2-year: $208.55 (anchor Aug 1, 2025) — price above both |
| RSI (14) | 63.59 (90d) / 63.54 (2y) — firm, below 70 · bearish divergence flagged |
| Mansfield RS vs the S&P 500 | +9.49%, slope flat · prior week +8.14% · prior month +9.57% |
| MACD (12,26,9) | 2.13 / signal 1.52 / histogram +0.61 · golden cross Oct 6, 2026 |
| ADX (14) | 13.71 (90d) / 13.07 (2y) — ranging, no strong trend |
| ATR (14) | $5.11 (2.00% of price) |
| OBV | 2y: early accumulation, above MA20 (+18.59%), flat · 90d: accumulation, above MA20 (+64.84%), rising · bullish divergence flagged |
| Volume | 530,000 vs 20-day avg 385,660 = 1.374× (market median that session 0.681×; ≈2.0× market-adjusted) |
| ATR stop references | 1×ATR $250.87 (−2.0%) · 2×ATR $245.75 (−4.0%) |
① Price & Moving Averages
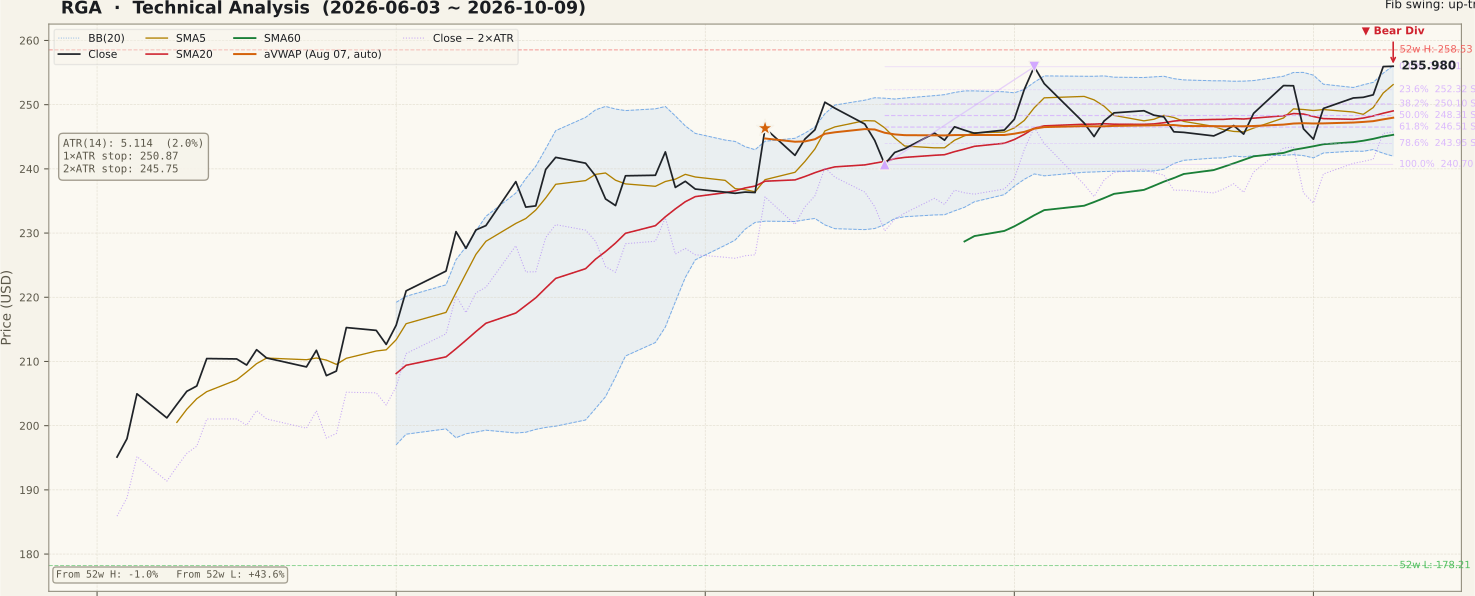
The two-year chart shows a long, heavy stretch: a slide from early-2025 highs, a range between roughly $180 and $210 that ran through most of 2025, and a 52-week low of $178.21 on October 31, 2025. A February 6, 2026 session (+9.40% on heavy volume) was the first sign of change, and the July 2026 advance carried price out of that range. The close has been above SMA60 since June 25. The two-year anchored VWAP sits far below at $208.55. None of the five gaps the tool found on the two-year frame remains unfilled.
On the 90-day frame the July leg peaked at $255.91 on September 3, pulled back to a $244.62 close on October 1, and has now returned to the top: closes of $255.93 on October 8 and $255.98 on October 9 sit just above that September high. The SMA5 > SMA20 > SMA60 stack, which broke on September 18 during the pullback, re-formed on September 29, and the close has held above SMA20 since October 2. Bollinger width of 5.66% is narrow — the bands have compressed around the range — and the close is pressed against the upper band at $256.07. Against the August 19 → September 3 up-swing ($240.70 → $255.91), the 23.6% retracement is $252.32 and the 38.2% is $250.10. The 90-day anchored VWAP of $247.96 (anchored on the August 7 session) lies under the range midpoint.
② Volume

October 9 traded 530,000 shares, 1.374× the 20-day average of 385,660. That came on an unusually quiet market day (universe median 0.681×), so relative to the tape the session was closer to 2× normal. Four of the last five sessions ran at roughly 1.3–1.5× average while the broad market was below its own average, which means the move back to the range top has had above-normal participation. None of those sessions approached a spike, and the daily price changes were small — this is steady volume, not an event. The September pullback, by contrast, ran mostly on below-average volume apart from a single heavy session on September 18.
③ MACD

MACD is 2.13 against a signal line of 1.52, a histogram of +0.61, after a golden cross on October 6. The cross came slightly above the zero line, after a long decline in MACD from its July peak near 9 — so this is a restart of upward momentum from a low level, not an extended reading. The panel also shows how choppy this has been: a late-September cross reversed within a day or two. The histogram has been growing for three sessions; a second quick fold back under the signal line would say the range is still in control.
④ RSI

RSI is 63.59 on the 90-day frame (63.54 on the two-year frame) — firm, but below 70. A bearish RSI divergence is flagged on both frames: on September 14 price was $249.05 with RSI 65.22 (90d), and on October 9 price was higher at $255.98 while RSI was slightly lower at 63.59. The gap between the two RSI readings is small, so this is a mild warning rather than a strong one, and a divergence is a possibility of a stall, not a confirmed top. RSI dipped into the high 40s on October 1 and recovered rather than breaking toward 40, which fits a range holding its floor.
⑤ Mansfield Relative Strength

Mansfield RS vs the S&P 500 is +9.49% with a flat slope. It was +8.14% a week earlier and +9.57% a month earlier, so it gained 1.35 points over the week (positive and accelerating) and is essentially unchanged over the month (−0.08 points, positive and marginally slowing). RS crossed above zero in early July and has stayed in roughly the +4% to +11% band since. On the two-year panel this is the most persistent stretch of outperformance in the window — most of 2025 was spent below zero. The leadership is real but moderate, and it has been flat rather than expanding.
⑥ ATR & ADX

ADX is 13.71 — a ranging market with no strong trend, and it has drifted lower all through September as price moved sideways. That is the main caution on this chart: the moving-average stack is bullish, but the directional reading behind it is weak. ATR is $5.11, or 2.00% of the price, which keeps the risk references close: 1×ATR at $250.87 and 2×ATR at $245.75, 4.0% below the close. The 2×ATR level sits just above SMA60 ($245.30) and near the October 1 range low, so it lines up with the structure rather than floating in empty space.
⑦ OBV

OBV reads accumulation on the 90-day frame — 4,671,100 against a 20-day average of 2,833,655 (+64.84%) and rising — and early accumulation on the two-year frame (+18.59% above its average, flat). The 90-day percentage is large partly because of the small starting base, so treat it as direction rather than magnitude. A bullish OBV divergence is flagged on both frames: price made a slightly lower low on October 1 ($244.62) than on September 21 ($245.13), while OBV made a higher low (1,944,300 vs 1,784,900 on the 90-day frame). That is the opposite message to the RSI divergence — volume flow says buyers were active at the range floor, while momentum says the push to the top is a little weaker than September's. Both are listed here rather than one being chosen.
Bull vs Bear
Bull Case
- Close > SMA5 > SMA20 > SMA60; the stack re-formed on September 29 after the pullback.
- $255.98 is the highest close of the past year, just above the September 3 swing high of $255.91.
- Mansfield RS +9.49% vs the S&P 500, above zero since early July and up 1.35 points on the week.
- OBV accumulation on the 90-day frame and a bullish OBV divergence at the October 1 range low.
- MACD golden cross on October 6 from a low level, histogram growing.
- Recent sessions ran at about 1.3–1.5× volume on a quiet tape — roughly 2× market-adjusted.
Bear Case
- ADX 13.71 — no strong trend behind the bullish moving-average order.
- Bearish RSI divergence: higher price than September 14 on slightly lower RSI.
- Close pressed against the upper Bollinger band ($256.07) with the 52-week high $258.53 just above.
- The range top near $256 has not been cleared on a closing basis by any real margin ($0.07).
- MACD crossed back and forth in late September; this cross has yet to prove it is different.
- Mansfield RS is flat over the month (+9.57% → +9.49%) — leadership is not expanding.
Scenarios
| Scenario | Probability | Path | Trigger / Invalidation |
|---|---|---|---|
| Range breakout | 35% | Price clears the $258.53 52-week high and the narrow Bollinger bands expand upward, with ADX turning up. | Trigger: close above $258.53 on volume above the 385,660 average. Invalidation: close back under the 23.6% level $252.32. |
| Range continues | 40% | The bearish RSI divergence plays out as a stall; price rotates back toward the $250.10–$249.03 zone (38.2% retracement and SMA20) inside the $244–$256 shelf. | Holds above SMA20 $249.03 and the 90-day aVWAP $247.96; RS stays above zero. |
| Range floor fails | 25% | The test of the top fails, MACD folds back under its signal, and price returns to the bottom of the range and through it. | Close below the 2×ATR reference $245.75 and SMA60 $245.30, below the October 1 low of $244.62. |
Key Levels
| Price | Role | Basis |
|---|---|---|
| $258.53 | Resistance | 52-week high (intraday, Oct 8, 2026) |
| $256.07 | Resistance | Upper Bollinger band (20) |
| $255.98 | Current | Close of Oct 9, 2026 · Sep 3 swing high $255.91 (0% of the swing) just below |
| $252.32 | Support | 23.6% retracement of the $240.70 → $255.91 swing |
| $250.10 | Support | 38.2% retracement · 1×ATR reference $250.87 just above |
| $249.03 | Support | SMA20 / Bollinger mid-band (50% retracement $248.31 just below) |
| $245.75 | Stop (2×ATR) | Objective invalidation, −4.0% from the close |
Further below: the 90-day anchored VWAP at $247.96, SMA60 at $245.30, the October 1 range-low close of $244.62 and the swing start at $240.70. On the two-year frame, the anchored VWAP at $208.55 is background, not a two-week level.
What to Watch
- A close above $258.53. Clearing the 52-week high on above-average volume would turn the five-week shelf into a base that has resolved upward.
- ADX at 13.71. A breakout that is real should lift ADX off its lows; a move higher with ADX still flat is more likely another range swing.
- The RSI divergence. RSI back above September's 65.22 on a higher price would erase it; RSI rolling toward 50 would confirm the stall.
- SMA20 at $249.03. Closes back below it would reopen the lower half of the range down to the $245.75 risk reference.
- Mansfield RS at +9.49%. A push to new highs in RS (above the roughly +11% peaks of the past quarter) would show leadership expanding, not just holding.
Conclusion
Past Analyses of This Stock same ticker · newest first
Other signals from this issue same publication date · 5 stocks
This analysis is an educational interpretation of chart data and is not investment advice. Probabilities and levels are subjective estimates; every investment decision, and its outcome, is your own responsibility. All figures are derived from closing-price data through October 9, 2026 and are not updated after publication.
Two Week Swing · twoweekswing.com · 4,600+ stocks screened weekly