WESCO International, Inc.
$365.69 −5.9% from 52-week high ($388.64)
This analysis is based on closing-price data as of October 9, 2026. Whether you're researching how to buy WESCO International, Inc. stock or you've just opened a brokerage account and are trying to time an entry, here are objective support levels and stop-loss references built from the RSI, MACD and ATR indicators.
Snapshot as of Oct 9 close · JSON values
| Item | Value | Note |
|---|---|---|
| Close | $365.69 | −5.9% from 52w high · +76.3% from 52w low |
| 52-week high / low | $388.64 / $207.39 | High = Oct 6, 2026 (intraday) |
| SMA5 / SMA20 / SMA60 | $369.78 / $359.66 / $351.08 | Bullish stack; close below SMA5, above SMA20 and SMA60 |
| Bollinger (20) | $389.41 / $359.66 / $329.92 | Band width 16.54% |
| aVWAP 90d (short-term) | $355.69 | Anchor Jul 30, 2026 |
| aVWAP 2y (long-term) | $311.58 | Anchor Oct 30, 2025 |
| RSI (14) | 52.72 (90d) · 52.73 (2y) | Neutral; no divergence flagged |
| Mansfield RS vs the S&P 500 | +9.76% | Outperform · prev week +16.71 · prev month +12.14 |
| MACD (12,26,9) | 5.56 / signal 5.83 / hist −0.27 | Dead cross on Oct 9 (above zero) |
| ADX (14) | 19.73 (90d) · 19.37 (2y) | Ranging / no trend strength |
| ATR (14) | $13.30 (3.64% of price) | Daily range reference |
| OBV | 90d: accumulation, rising, +10.34% vs MA20 · 2y: early accumulation, flat, +3.23% | No OBV divergence flagged |
| Volume | 844,000 vs 20-day avg 523,780 | Vol/Avg 1.61x |
| 1× / 2× ATR stop | $352.39 / $339.09 | 2× ATR = −7.27% from close |
① Price & Moving Averages
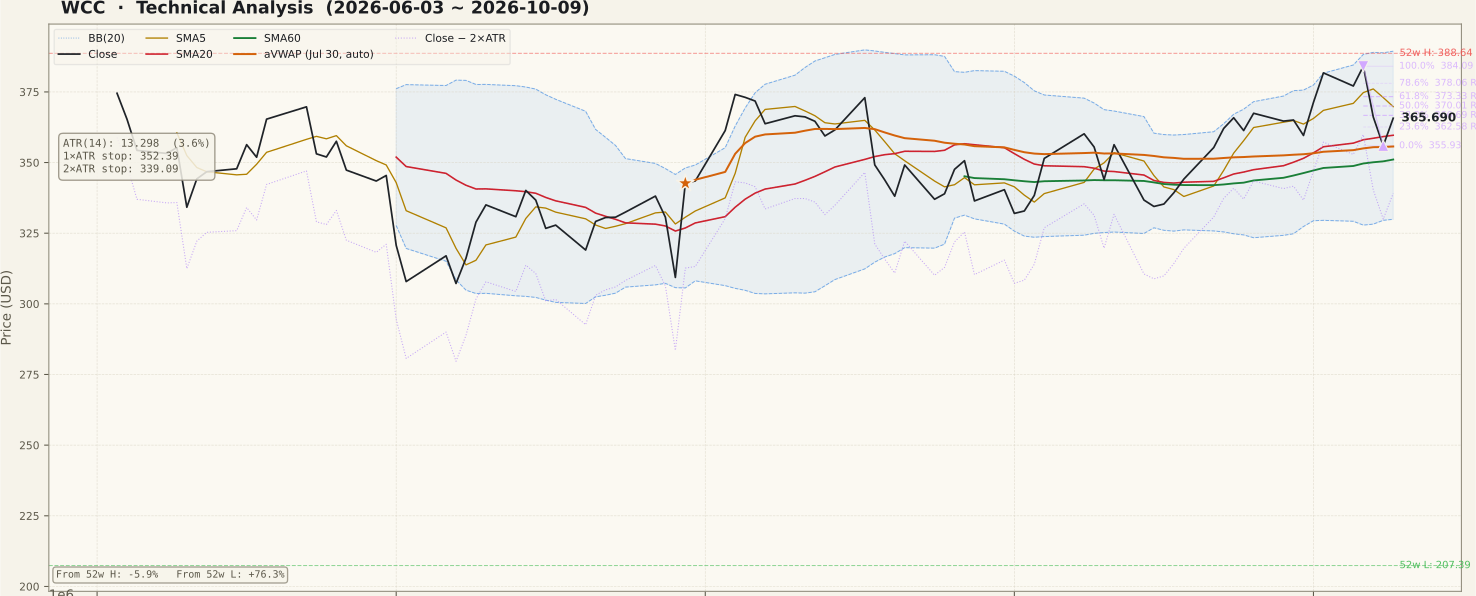
The short-term averages have been stacked bullishly (SMA5 > SMA20 > SMA60) since September 22, and the close has held above the SMA60 ($351.08) since September 18. That is the structure this page was screened on: a trend pullback in an established uptrend. The pullback itself was quick — the October 8 close of $355.93 dipped below the SMA20, and Friday's $365.69 close moved back above it ($359.66), although the price still sits below the SMA5 ($369.78), which has turned down.
The 90-day Fibonacci grid is drawn on the October 6 → October 8 decline ($384.09 → $355.93). Friday's close is just under the 38.2% retracement at $366.69, with the 50% level at $370.01 and the 61.8% level at $373.33 above. The 23.6% level at $362.58 is tagged as resistance in the data but was already reclaimed by Friday's close. On the longer 2-year grid (July 29 low $309.36 → August 4 high $374.10), the price sits between the 0% anchor and the 23.6% support at $358.82.
The 90-day anchored VWAP from July 30 sits at $355.69 — almost exactly the October 8 closing low — so buyers since that session are, on average, still in profit. The 2-year aVWAP from October 30, 2025 is far lower at $311.58. One older unfilled gap remains on the 2-year chart at $281.24–$291.93 (April 8, 2026), well away from current prices. The Bollinger mid-band coincides with the SMA20 at $359.66, while the upper band ($389.41) is essentially at the 52-week high.
② Volume

Friday's volume was 844,000 shares against a 20-day average of 523,780, a 1.61x ratio. The two down sessions before it (October 7 and 8) also traded at elevated volume, so the pullback and the rebound were both active — participation did not dry up on the decline, which is what a textbook quiet pullback would show.
The broader tape was quiet that week: across a sample of U.S. stocks, typical volume ran below its own 20-day average on each session from October 5 to October 9. Measured against that backdrop, WCC's activity stands out more than the raw 1.61x suggests. None of these sessions reached the 2x volume-spike threshold drawn on the chart, and the largest volume bars of the 90-day window remain those around late July.
The open question is which side owns the heavier volume. Two heavy red sessions followed by one heavy green session is roughly a draw; a follow-through day above $370 on similar volume would tilt it toward buyers.
③ MACD

The MACD line (5.56) slipped under its signal line (5.83) on October 9, registering a dead cross even though the price rose that day — the indicator is reacting to the two prior down sessions. The histogram is only −0.27, a marginal crossover rather than a sharp rollover.
Context matters: the cross happened well above the zero line, which typically signals momentum cooling inside an uptrend rather than a trend reversal. The chart shows a similar pattern in mid-August, when a dead cross above zero was followed by several weeks of sideways-to-lower trading before momentum recovered. A quick re-cross back above the signal line would mark the pullback as shallow; a widening negative histogram would point to a longer consolidation.
④ RSI

RSI stands at 52.72, back near the 50 midline after peaking in the low 60s during the early-October run. The stock never reached overbought territory (above 70) on that advance, and the pullback did not push RSI anywhere near oversold.
No RSI divergence is flagged in either timeframe. A neutral reading like this leaves room in both directions: holding above 50 is consistent with an intact uptrend, while a slide back into the mid-40s — where RSI bottomed during the September consolidation — would suggest the range is reasserting itself.
⑤ Mansfield Relative Strength

Mansfield RS vs the S&P 500 is +9.76%, so WCC continues to outperform the index, as it has throughout the 90-day window. The reading has, however, cooled: it was +16.71 a week earlier (a −6.95 point change) and +12.14 a month earlier (−2.38 points). Both changes are negative while RS remains positive, which places the stock in the "positive but slowing" quadrant.
The JSON slope tag still reads "rising" — that is a smoothed measure, whereas the point-to-point changes capture last week's drop. The practical read is that leadership versus the market is intact but has lost some edge; a renewed move toward the high teens would confirm the pullback is over, while a slide toward zero would weaken the outperformance case.
⑥ ATR · ADX

ATR is $13.30, or 3.64% of price, and it ticked up during the October 7–9 swings. That sets the 1× ATR reference at $352.39 and the 2× ATR reference at $339.09, about 7.27% below the close. A normal day's range is wide enough that a stop placed only a dollar or two under recent lows would sit inside ordinary noise.
ADX reads 19.73 on the 90-day chart, below the 20 threshold, meaning there is no strong trend in either direction right now despite the higher-high structure in price. The averages are aligned, but trend strength is not confirming — a reason to treat a breakout attempt toward the 52-week high with some caution until ADX starts rising above 20–25.
⑦ OBV (On-Balance Volume)

On the 90-day view OBV is in "accumulation": it sits 10.34% above its 20-day average and the average is rising. Friday's heavy up day lifted OBV back above that average after the October 7–8 dip. On the 2-year view the state is "early accumulation" — OBV is 3.23% above its average with a flat slope, so the longer-run volume trend is supportive but not emphatic.
No OBV divergence is flagged in either timeframe. The 90-day OBV made a higher high in early October alongside price, so the recent advance was volume-confirmed rather than a price-only move.
Bull vs Bear
Bull Case
- SMA5 > SMA20 > SMA60 since Sep 22; close above SMA60 since Sep 18.
- Friday's close ($365.69) reclaimed the SMA20 ($359.66) after a one-day dip below it.
- Oct 8 low close ($355.93) held at the 90d aVWAP ($355.69).
- Mansfield RS +9.76% vs the S&P 500 — still outperforming.
- 90d OBV in accumulation, +10.34% above its rising MA20.
- Only 5.9% below the 52-week high, inside a 2-year uptrend.
Bear Case
- MACD dead cross on Oct 9, histogram turning negative.
- ADX 19.73 — no confirmed trend strength.
- Two-session drop of about 7% came on elevated volume.
- RS cooled from +16.71 to +9.76 in one week (positive but slowing).
- Close still below the falling SMA5 ($369.78) and the 38.2% retracement ($366.69).
- 2× ATR stop sits 7.27% below — a wide risk band.
Scenarios
| Scenario | Probability | Path | Trigger / Invalidation |
|---|---|---|---|
| Pullback resolves higher | 40% | Recovery through $366.69 and $373.33, then a retest of the $384.09 closing high and $388.64 52-week high. | Trigger: daily close above $373.33 with MACD back over its signal line. Invalidation: close below $355.69. |
| Range-bound consolidation | 35% | Chop between roughly $355 and $375 as MACD cools and ADX stays below 20. | Trigger: repeated failures near $370–373 with RSI holding around 45–55. Ends on a decisive break of either edge. |
| Deeper pullback | 25% | Loss of the 90d aVWAP and SMA60, extending toward the 2y Fibonacci 50% ($341.73) and the 2× ATR reference. | Trigger: close below $351.08 (SMA60). Invalidation of the uptrend read: close below $339.09. |
Key Levels
| Price | Role | Basis |
|---|---|---|
| $388.64 | Resistance | 52-week high (Oct 6 intraday) · Bollinger upper $389.41 |
| $373.33 | Resistance | 90d Fibonacci 61.8% retracement |
| $366.69 | Resistance | 90d Fibonacci 38.2% retracement |
| $365.69 | Current | Oct 9 close |
| $359.66 | Support | SMA20 / Bollinger mid · 2y Fib 23.6% $358.82 |
| $355.69 | Support | 90d aVWAP (Jul 30 anchor) · Oct 8 close $355.93 |
| $339.09 | Stop (2× ATR) | Close − 2 × ATR $13.30 |
What to Watch
- Whether closes hold above the SMA20 ($359.66) and the 90d aVWAP ($355.69) — the two levels that defined last week's low.
- A MACD re-cross above its signal line, which would mark the Oct 9 dead cross as a brief pause.
- Volume on the next up day: a move above $370 on above-average volume would tilt the heavy-volume tug-of-war toward buyers.
- Mansfield RS direction — stabilizing near +10% or recovering toward the high teens versus sliding toward zero.
- ADX rising above 20 to confirm any renewed push toward $384–$389.
Conclusion
Past Analyses of This Stock same ticker · newest first
Other signals from this issue same publication date · 5 stocks
This analysis is an educational interpretation of chart data and is not investment advice. Probabilities and levels are subjective estimates; every investment decision, and its outcome, is your own responsibility. A bottoming or pullback-recovery signal is not a buy signal, and technical signals alone are not a basis for buying any stock.
Two Week Swing · twoweekswing.com · 4,600+ stocks screened weekly