Concentra Group Holdings Parent, Inc.
$35.65 −2.9% from 52-week high · +92.2% from 52-week low
This analysis is based on closing-price data as of October 2, 2026. Whether you're researching how to buy Concentra Group Holdings Parent, Inc. stock or you've just opened a brokerage account and are trying to time an entry, here are objective support levels and stop-loss references built from the RSI, MACD and ATR indicators.
Snapshot as of October 2, 2026 close
| Item | Value | Read |
|---|---|---|
| Close | $35.65 | −2.9% from 52w high $36.71 · +92.2% from 52w low $18.55 |
| Moving averages | SMA5 $35.15 · SMA20 $35.02 · SMA60 $33.67 | Close > 5 > 20 > 60 (bullish order; 5/20 spread is thin) |
| Bollinger (20) | $36.27 / $35.02 / $33.76 · width 7.16% | Narrow band; close in the upper half |
| aVWAP | 90d $34.85 (Aug 7 anchor) · 2y $23.68 (Nov 26, 2024 anchor) | Above both anchors |
| RSI (14) | 58.12 | Neutral-positive; bearish divergence vs Aug 17 |
| Mansfield RS vs the S&P 500 | +31.22% (prev week 29.59 · prev month 30.50) | Outperforming, positive-accelerating |
| MACD (12,26,9) | 0.288 / signal 0.350 / hist −0.062 | Dead cross Sep 21, still above zero |
| ADX (14) | 15.65 | Ranging / weak trend |
| ATR (14) | $0.97 (2.72% of price) | Moderate volatility |
| OBV 2y | Distribution · −8.31% vs MA20 · falling | Below its MA, bearish divergence |
| OBV 90d | Distribution · −13.28% vs MA20 · falling | Below its MA, bearish divergence |
| Volume | 1,381,600 vs MA20 1,008,945 (1.37x) | Above average on an up day (~1.56x after market adjustment) |
| ATR stops | 1× $34.68 · 2× $33.71 | 2×ATR = −5.4% from close |
① Price & Moving Averages
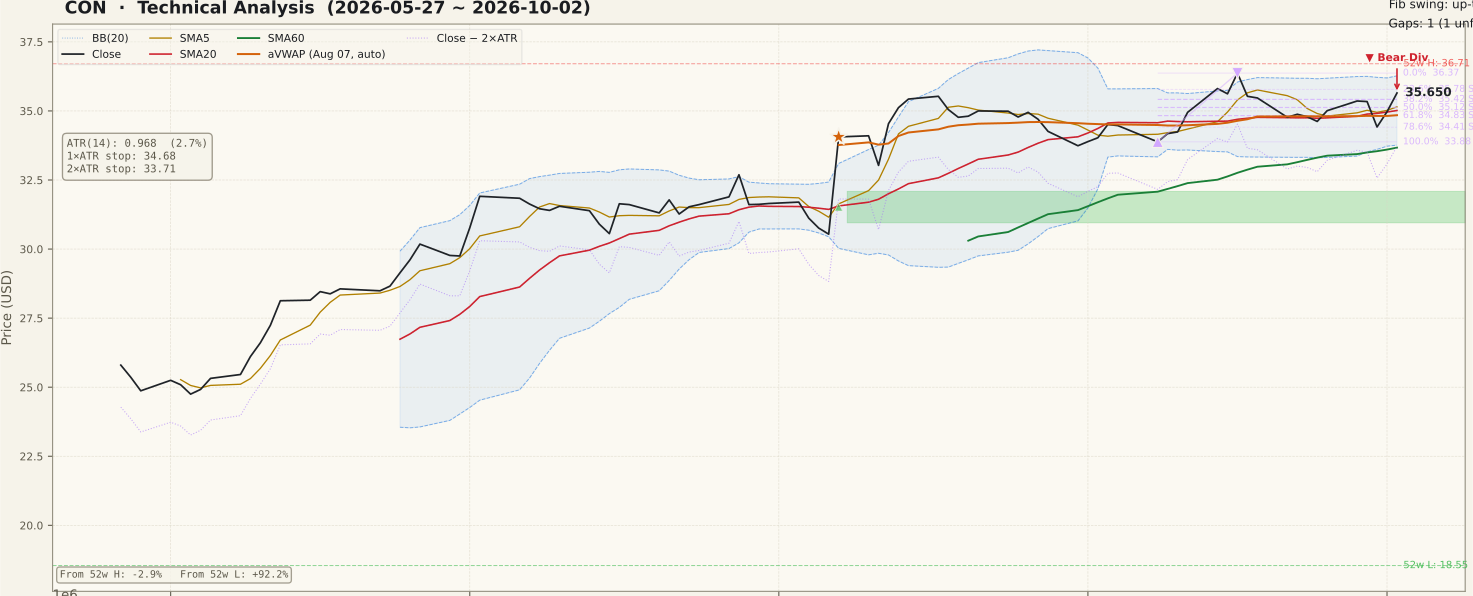
The two-year picture is a range-to-trend transition: roughly $19–$24 from late 2024 into early 2026, then a persistent climb from April that carried through a gap on August 7 (still unfilled between $30.95 and $32.09) and into a sideways shelf around $34–$36.7. Today the close of $35.65 sits above SMA5 ($35.15), SMA20 ($35.02) and SMA60 ($33.67), and the full SMA5 > SMA20 > SMA60 order first held on September 15, on an ordinary −0.53% session — it was not created by a single event bar. The SMA20 has been above the SMA60 since early May, so the longer structure is intact; the short averages, however, are nearly flat and bunched together, which is what a range looks like rather than an accelerating trend.
On the short swing from the September 8 low ($33.88) to the September 16 high ($36.37), the close sits between the 38.2% retracement at $35.42 and the 23.6% level at $35.78, which is just above price and has to be reclaimed. The 90-day aVWAP anchored on August 7 is $34.85, almost exactly the 61.8% retracement ($34.83) — a clustered support zone. Bollinger width is a narrow 7.16%, with the upper band at $36.27 near the 52-week high.
② Volume

The last session printed 1,381,600 shares against a 20-day average of 1,008,945, a 1.37x ratio on a +1.94% up day. The broad market was quiet that day, so relative to the market the figure is closer to about 1.56x — a modest, not dramatic, pickup. The tallest bar on the 90-day panel is September 18, roughly 6.7 times the average at the time, but that session was the quarterly options expiration and S&P index rebalance trading day, when volume across the market ran well above normal; CON closed essentially flat (−0.17%) and was not part of the announced September index changes. That spike reads as rebalance-day flow, not as accumulation or distribution, and because it still sits inside the 20-day window it also inflates the current average that today's ratio is measured against.
③ MACD

MACD is 0.288 against a signal of 0.350, with a histogram of −0.062; the last cross was a dead cross on September 21, following a brief golden cross in mid-September. The lines remain above zero, so the medium-term momentum backdrop is still positive, but the series of lower MACD peaks since July shows the advance losing speed. The latest histogram bar is shrinking toward zero, which would be the first condition for another golden cross — not yet in place.
④ RSI

RSI is 58.12 — above the 50 midline, far from overbought. The chart flags a regular bearish divergence: on August 17 the close was $35.53 with RSI at 70.9, while on October 2 the close was a slightly higher $35.65 with RSI only 58.12. Price made a marginally higher high on materially weaker momentum. That is a caution sign about the quality of the advance near the highs, not a confirmed top; it would gain weight only if price fails to clear the $36.37–$36.71 zone and slips back below the cluster around $34.85.
⑤ Mansfield Relative Strength

Mansfield RS vs the S&P 500 is +31.22%, firmly in outperformance territory. Against the prior week's 29.59 that is +1.64 points, and against the prior month's 30.50 it is +0.73 points — both positive changes, so the reading is positive and accelerating, though the JSON slope tag is flat and the line has essentially plateaued between roughly 28 and 38 since July. Relative strength is the strongest leg of this setup: even while price went sideways, CON held its lead over the index.
⑥ ATR & ADX

ATR(14) is $0.97, or 2.72% of price, giving a 1×ATR reference at $34.68 and a 2×ATR reference at $33.71. ATR spiked after the August 7 gap and has since eased, with a small uptick in the last few sessions. ADX is 15.65, in ranging territory: there is no strong trend in either direction right now. That fits the sideways shelf and argues for treating range edges as the meaningful levels rather than assuming the spring trend resumes on its own.
⑦ OBV

OBV is in "distribution" on both timeframes: 13.28% below its 20-day average on the 90-day window and 8.31% below on the 2-year window, with a falling slope on each. The chart also reports a bearish OBV divergence — on the 90-day window OBV was 14,089,200 at the August 17 peak and 9,567,400 on October 2, while price was slightly higher. Context matters here: the sharpest leg of that OBV drop came from the September 17–18 sessions, and OBV assigns a bar's entire volume by the sign of the close, so the very large September 18 rebalance-day volume on a −0.17% close subtracted heavily even though price barely moved. The divergence is real in the data, but part of it reflects that mechanical effect rather than sustained selling; a recovery of OBV above its MA20 would neutralise the reading.
Bull Case vs Bear Case
Bull Case
- Close above SMA5, SMA20 and SMA60 in bullish order; the full order formed on an ordinary session (Sep 15).
- Mansfield RS +31.22% vs the S&P 500, positive and accelerating week-over-week and month-over-month.
- Price is only 2.9% below the 52-week high after a sideways consolidation rather than a deep pullback.
- Above both the 90-day aVWAP ($34.85) and the 2-year aVWAP ($23.68).
- Narrow Bollinger width (7.16%) — volatility compression often precedes a directional move.
- Last session closed up 1.94% on above-average volume (1.37x).
Bear Case
- RSI bearish divergence: higher close than Aug 17 on RSI 58.12 vs 70.9.
- OBV in distribution on both 2y and 90d, with a bearish OBV divergence.
- MACD below its signal since the Sep 21 dead cross, with lower MACD peaks since July.
- ADX 15.65 — no trend strength; the range can persist or break either way.
- Repeated failures near $36.37–$36.71 so far; overhead supply right at the 52-week high.
- SMA5 and SMA20 are bunched together, so the bullish order is fragile to a few weak closes.
Scenarios
| Scenario | Probability | Path | Trigger / Invalidation |
|---|---|---|---|
| Range continues | 45% | Sideways between roughly $34.85 and $36.71 while the divergences resolve | Holds above $34.85 but cannot close above $36.37; invalidated by a decisive break either way |
| Upside resolution | 30% | Close above the $36.37 swing high, then a test of and push through $36.71 | Trigger: close above $36.71 with volume above average; invalidated by a return below $35.42 |
| Range breaks lower | 25% | Loses the $34.85 cluster, then the $33.88 swing low and the SMA60 area | Trigger: close below $33.71 (2×ATR); the Aug 7 gap ($30.95–$32.09) is the next reference below |
Key Levels
| Price | Role | Basis |
|---|---|---|
| $36.71 | Resistance | 52-week high |
| $36.37 | Resistance | Sep 16 swing high (0% of the swing) |
| $35.65 | Current | Oct 2 close |
| $35.42 | Support | 38.2% retracement of the Sep 8–16 swing |
| $34.85 | Support | 90-day aVWAP (Aug 7 anchor) · 61.8% retracement $34.83 |
| $33.88 | Support | Sep 8 swing low (100% of the swing) |
| $33.71 | Stop (2×ATR) | Close − 2×ATR; SMA60 $33.67 just below |
What to Watch
- A close above $36.37 and then $36.71 on above-average volume — the first sign the range is resolving upward.
- Whether OBV can climb back above its 20-day average, which would neutralise the distribution tag.
- A new MACD golden cross while the lines are still above zero.
- Defence of the $34.85 aVWAP / 61.8% cluster on any pullback; a close below $33.71 breaks the setup.
- Mansfield RS holding above +30% — a fade toward zero would weaken the main argument for the setup.
Conclusion
Past Analyses of This Stock same ticker · newest first
Other signals from this issue same publication date · 6 stocks
This analysis is an educational interpretation of chart data and is not investment advice. Probabilities and levels are subjective estimates; every investment decision, and its outcome, is your own responsibility. A bottoming or breakout signal on a chart is not by itself a reason to buy.
Two Week Swing · twoweekswing.com · 4,600+ stocks screened weekly