Hafnia Limited
$10.25 −0.3% from 52-week high · +98.3% from 52-week low
This analysis is based on closing-price data as of October 2, 2026. Whether you're researching how to buy Hafnia Limited stock or you've just opened a brokerage account and are trying to time an entry, here are objective support levels and stop-loss references built from the RSI, MACD and ATR indicators.
Snapshot as of October 2, 2026 close
| Item | Value | Read |
|---|---|---|
| Close | $10.25 | Highest close in 52 weeks |
| 52-week high / low | $10.28 / $5.17 | −0.3% / +98.3% |
| SMA 5 / 20 / 60 | $9.81 / $9.47 / $8.33 | Close > 5 > 20 > 60 (bullish alignment) |
| Bollinger (20) upper / mid / lower | $10.29 / $9.47 / $8.65 | Width 17.34% · close pressing upper band |
| Anchored VWAP — 90d | $9.34 (anchor Sep 8, 2026) | Close above |
| Anchored VWAP — 2y | $6.51 (anchor Feb 27, 2025) | Close well above |
| RSI (14) | 69.37 (90d) / 69.33 (2y) | Bearish divergence vs Sep 4 peak |
| Mansfield RS vs the S&P 500 | +31.12% | Outperform · rising · accelerating |
| MACD (12,26,9) | 0.376 / signal 0.349 / hist +0.028 | Golden cross Oct 2 |
| ADX (14) | 25.69 (90d) / 25.38 (2y) | Strong (just above 25) |
| ATR (14) | $0.37 (3.57% of price) | Volatility rising |
| OBV — 2y / 90d | Early accumulation / early accumulation | Above MA20, slope flat on both |
| Volume vs 20-day avg | 0.804x | Below average on breakout day |
| 1× / 2× ATR stop | $9.88 / $9.52 | −3.6% / −7.1% from close |
① Price & Moving Averages
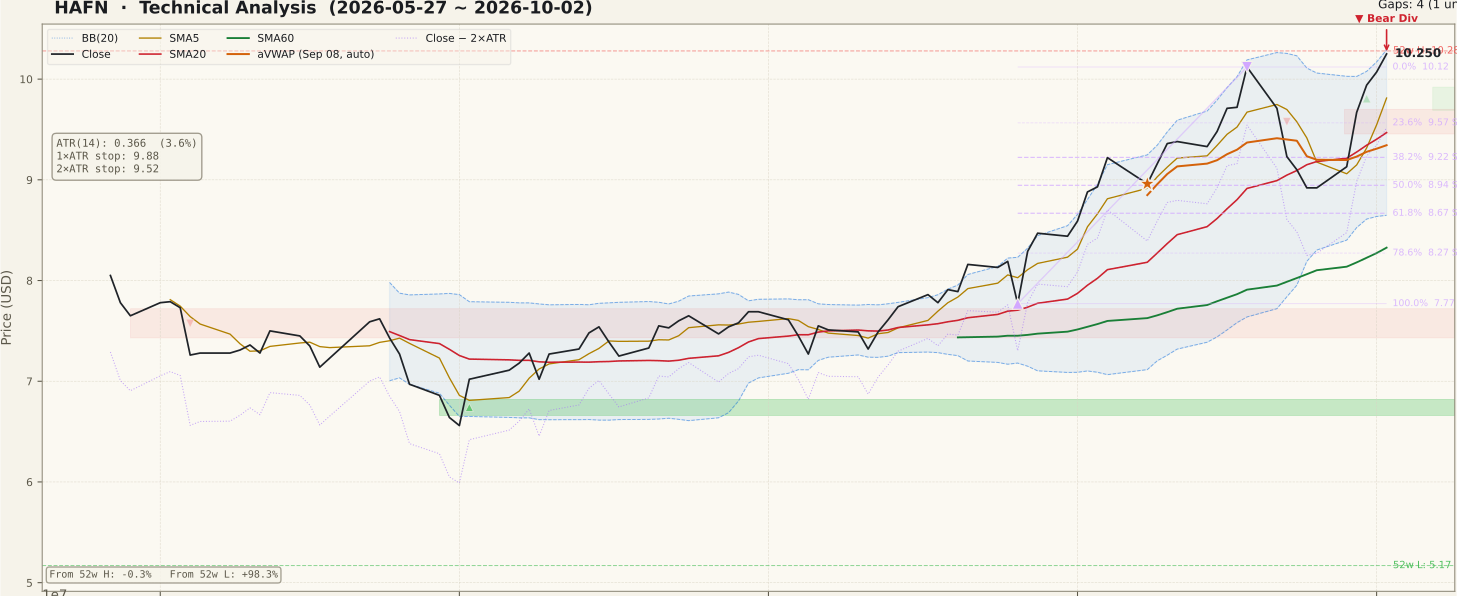
On the two-year chart, HAFN bottomed in spring 2025, built a base through late 2025, rallied into a May 2026 peak, then gave much of it back into a July low. The current leg began from the August base: SMA20 crossed above SMA60 on Aug 10, price has held above SMA60 since Aug 12, and the full stack Close > SMA5 ($9.81) > SMA20 ($9.47) > SMA60 ($8.33) has been in place since Sep 30. The stock made repeated 20-day-high closes from Sep 4 through Sep 18 (swing high $10.12), pulled back to $8.92 by Sep 24–25, and then recovered the whole drop in five sessions.
The Fibonacci grid is drawn on the Aug 26 low ($7.77) to Sep 18 high ($10.12) up-swing. The Oct 2 close sits above the 0% anchor at $10.12 — that prior swing high is the level the stock just cleared — with the 23.6% retracement at $9.57 and the 38.2% at $9.22 below. The close is above both anchored VWAPs ($9.34 for the Sep 8 anchor, $6.51 for the Feb 2025 anchor), so recent and long-term buyers are both in profit. Price is riding the upper Bollinger Band ($10.29); band-walking signals strength, but it also leaves little room before the band itself acts as a ceiling.
One older event explains the shape of late September: on Sep 24 the stock opened sharply lower and closed −1.98% on 4.18x average volume, the day Hafnia completed a placement of about 35.5M new shares (NOK 80 per share, roughly USD 300M gross) to repay a BW Group shareholder loan used for its roughly 18% TORM stake purchase. Hafnia is the buyer of that stake, not a target. That session sits outside the latest five-session window and the shares have since recovered above the pre-placement level. The only unfilled gap on the 90-day chart is far below, at $6.66–$6.82 (Jul 2).
② Volume

This is the weakest part of the setup. The breakout close on Oct 2 traded 2.57M shares against a 20-day average of 3.19M — a ratio of 0.804x. The whole market was quiet that day (the median stock traded about 0.875x its own average), so on a market-adjusted basis HAFN was roughly in line (about 0.92x), not standing out. A breakout to a 52-week closing high without above-average participation is a classic thing to be skeptical of.
The heavier volume in the recovery came earlier: Sep 29 (+5.91%) was the strongest session at about 1.71x average. The 20-day average itself is inflated by the 9.68M-share placement day on Sep 24 and the 4.31M-share follow-through on Sep 25, which makes the current ratio look a bit lower than "normal" trading would. Even allowing for that, the last three up days ran on progressively lighter volume.
③ MACD

MACD (0.376) crossed back above its signal line (0.349) on Oct 2, turning the histogram positive (+0.028) after a short negative stretch that followed the late-September dead cross. The cross happened well above the zero line, so it reads as a re-acceleration inside an existing uptrend, not an early-trend signal. Note that the MACD line remains below its mid-September peak while price is now higher — the momentum has not fully kept pace with the new price high, which echoes the RSI read below.
④ RSI

RSI stands at 69.37, just under the 70 overbought line. The chart flags a regular bearish divergence: on Sep 4 price closed at $9.22 with RSI at 75.65, while on Oct 2 price closed higher at $10.25 with RSI lower at 69.37 (the 2-year file shows the same pair, 75.44 and 69.33). Higher price on lower momentum says the latest push is less forceful than the early-September one. A divergence is a possibility of a top, not a confirmed one — it only matters if price subsequently fails to hold the breakout area.
⑤ Mansfield Relative Strength

Relative strength vs the S&P 500 is the strongest pillar. Mansfield RS is +31.12%, up from 14.61% a week ago (+16.51 points) and 16.63% a month ago (+14.50 points) — positive and accelerating on both horizons. RS has stayed above zero since mid-August and has nearly returned to its September peak. Keep the source in mind: tanker peers (DHT, NAT, INSW, FRO, STNG) rose together between Sep 28 and Oct 2, so a large part of this outperformance is a sector move rather than something specific to Hafnia.
⑥ ATR & ADX

ATR has climbed to $0.37 (3.57% of price), the highest reading of the 90-day window, after bottoming in August. Rising volatility during an advance is normal, but it widens objective stops: 1× ATR sits at $9.88 and 2× ATR at $9.52. ADX at 25.69 marks a trend that has just crossed into "strong" territory, though the line has been drifting slightly lower from its mid-September level — trend strength is present but not expanding.
⑦ OBV

OBV reads early accumulation on both timeframes: above its 20-day average, slope flat. On the 90-day view OBV sits 92.55% above its MA20 (on the 2-year view, 48.99%) — that is the gap between OBV and its own average, a measure of accumulation strength, not a divergence. No OBV divergence is flagged on either timeframe. The 90-day panel shows OBV dropped sharply around the Sep 24 placement and then rebuilt to a new high with price, so the volume flow has confirmed the recovery even though the single breakout day was light.
Bull vs Bear
Bull Case
- Highest close in 52 weeks ($10.25), above the prior 20-day high and the Sep 18 swing high ($10.12).
- Full bullish alignment Close > SMA5 > SMA20 > SMA60, with SMA20 above SMA60 since Aug 10.
- Mansfield RS +31.12% vs the S&P 500, accelerating (+16.51 points in a week).
- MACD golden cross on Oct 2, well above the zero line.
- OBV in early accumulation on both 2y and 90d and back at a new high with price.
- Price above both anchored VWAPs ($9.34 and $6.51) — little overhead supply from recent buyers.
Bear Case
- Breakout on below-average volume (0.804x; about 0.92x market-adjusted).
- RSI bearish divergence: higher price on Oct 2 vs Sep 4, lower RSI (69.37 vs 75.65).
- Close is pressing the upper Bollinger Band ($10.29) after a +14.9% five-session run.
- The move is sector-wide across tankers — it can reverse as a group.
- ATR at a 90-day high widens the distance to an objective stop (2× ATR = −7.1%).
- Recent dilution: ~35.5M new shares placed on Sep 24, a supply the market has only just absorbed.
Scenarios
| Scenario | Probability | Path | Trigger / Invalidation |
|---|---|---|---|
| Breakout holds and extends | 40% | Price holds above $10.12 and builds a base above the old swing high, with volume picking up on up days. | Trigger: closes above $10.28 on above-average volume. Invalidation: close back below $10.12. |
| Pullback / consolidation | 40% | Overbought RSI and the divergence cool off; price retests the $9.57–$9.88 zone (23.6% retracement to 1× ATR) and holds above SMA20. | Holds if closes stay above SMA20 ($9.47). Shifts bearish below the 2× ATR stop ($9.52). |
| Failed breakout | 20% | The low-volume breakout fails and the divergence plays out; price falls back toward the 38.2% retracement ($9.22) and the 90d aVWAP ($9.34). | Trigger: close below $9.52. Recovery above $10.12 would cancel it. |
Key Levels
| Price | Role | Basis |
|---|---|---|
| $10.28 | Resistance | 52-week intraday high (Oct 2) · upper Bollinger Band $10.29 |
| $10.25 | Current | Oct 2 close |
| $10.12 | Breakout line | Sep 18 swing high · Fibonacci 0% anchor of the Aug 26–Sep 18 swing |
| $9.88 | Support | 1× ATR stop reference |
| $9.57 | Support | Fibonacci 23.6% retracement |
| $9.52 | Stop (2× ATR) | Close − 2× ATR · −7.1% from close |
| $9.47 | Support | SMA20 · Bollinger mid |
What to Watch
- Volume on the next push: any close above $10.28 on volume above the 20-day average (3.19M) would repair the weak-volume flaw of the Oct 2 breakout.
- Hold of $10.12: the old swing high should act as support; a quick close back below it turns the breakout into a false start.
- RSI vs 75.65: a new RSI high above the Sep 4 peak would cancel the bearish divergence; a drop below 50 would confirm it.
- Tanker peers: DHT, NAT, INSW, FRO and STNG moved with HAFN — a group reversal would likely pull it down too.
- SMA20 ($9.47) and the 2× ATR stop ($9.52): the objective line where the uptrend structure is in question.
Conclusion
Past Analyses of This Stock same ticker · newest first
Other signals from this issue same publication date · 6 stocks
This analysis is an educational interpretation of chart data and is not investment advice. Probabilities and levels are subjective estimates; every investment decision, and its outcome, is your own responsibility.
Two Week Swing · twoweekswing.com · 4,600+ stocks screened weekly