Twilio Inc.
$294.58 −3.7% from the 52-week high of $305.95 · +196.9% from the 52-week low of $99.22
This analysis is based on closing-price data as of October 2, 2026. Whether you're researching how to buy Twilio Inc. stock or you've just opened a brokerage account and are trying to time an entry, here are objective support levels and stop-loss references built from the RSI, MACD and ATR indicators.
Over two years Twilio has gone from a long sideways range around $100–$145 to a strong 2026 uptrend that has nearly tripled the stock off its 52-week low, and it now sits 3.7% under its 52-week high. Mansfield relative strength of +67.2% against the S&P 500 is high and still accelerating, and the close stands above a fully stacked SMA5 > SMA20 > SMA60. The short-term picture is a trend that has been absorbing pullbacks — a sharp −7.96% drop on September 25 was recovered within four sessions to a new closing high on October 1, followed by a −2.22% dip on October 2. The lens for this page is a strong but extended trend: the structure is intact, while the distance above SMA20 and a wide ATR make the risk reference far from the price.
Snapshot all figures from the chart JSON · as of October 2, 2026
| Close | $294.58 |
|---|---|
| 52-week high / low | $305.95 (−3.7%) / $99.22 (+196.9%) |
| SMA5 / SMA20 / SMA60 | $293.21 / $261.52 / $231.75 — close > SMA5 > SMA20 > SMA60, bullish alignment |
| Bollinger Bands (20) | Upper $319.30 · Mid $261.52 · Lower $203.73 · width 44.19% (expanded) |
| Anchored VWAP | 90-day: $254.03 (anchor Aug 7, 2026) · 2-year: $141.01 (anchor Jan 24, 2025) — price above both |
| RSI (14) | 65.74 — firm, below the 70 overbought line · no divergence |
| Mansfield RS vs the S&P 500 | +67.20%, rising · prior week +59.29% · prior month +45.29% |
| MACD (12,26,9) | 18.22 / signal 15.26 / histogram +2.97 · golden cross Sep 17, 2026 |
| ADX (14) | 34.31 — strong trend |
| ATR (14) | $14.10 (4.79% of price) |
| OBV | 2y: accumulation, above MA20 (+11.38%), rising · 90d: accumulation, above MA20 (+111.51%), rising · no divergence |
| Volume | 3,673,600 vs 20-day avg 2,686,835 = 1.367× (market median that session 0.875×; ≈1.56× market-adjusted) |
| ATR stop references | 1×ATR $280.48 · 2×ATR $266.39 (−9.6%) |
① Price & Moving Averages
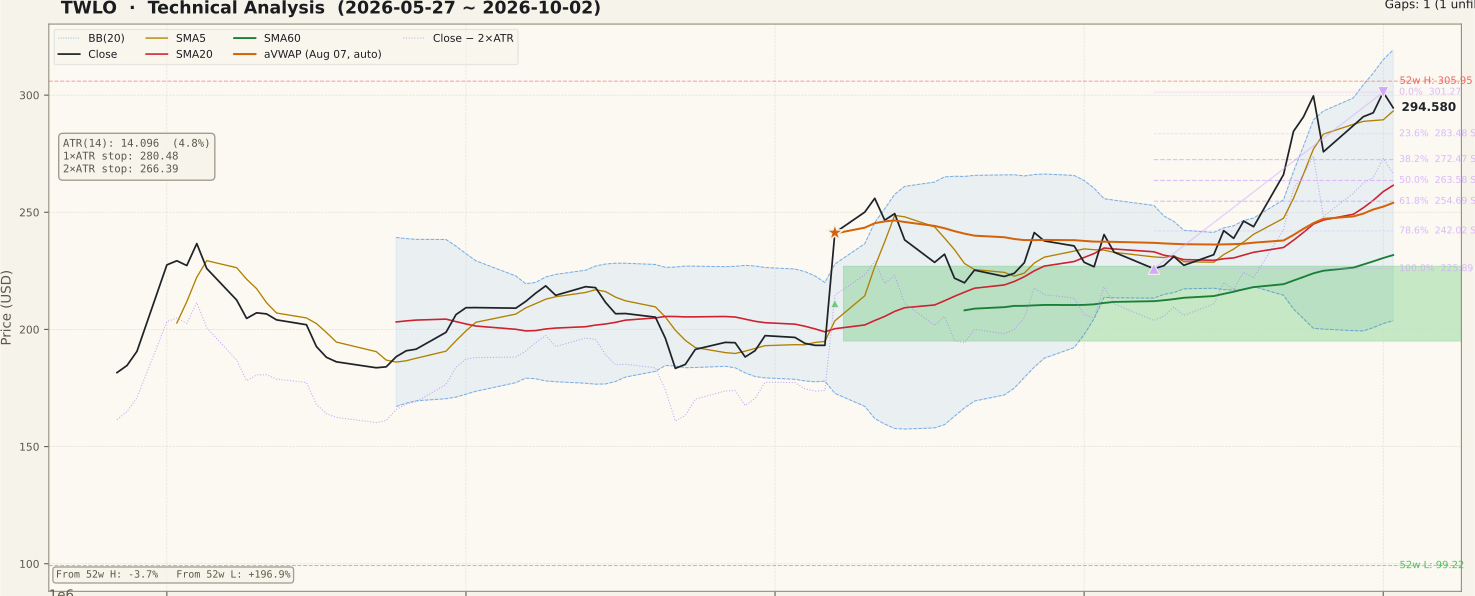
The two-year chart shows a long range between roughly $100 and $145 through 2025, then a 2026 breakout leg that left an unfilled support gap at $148.57–$171.01 (May 1, 2026) and a second one at $194.99–$227.02 created by the August 7 Q2 results session (+24.9% on about 4.2× volume, revenue $1.50B, +22% year over year, with a raised organic-growth outlook). That gap is two months old and is described here as background, not as a current event. On the 90-day frame the close of $294.58 sits just above SMA5 ($293.21) and well above SMA20 ($261.52) and SMA60 ($231.75). The short-term SMA5 > SMA20 > SMA60 stack first held on September 15 (a +4.43% session on about 1.30× volume); SMA20 has been above SMA60 since August 11 and the close above SMA60 since August 7.
Bollinger width of 44.19% is wide, and the upper band at $319.30 is above the price after the late-September run pressed against it. The current up-swing runs from the September 8 low of $225.89 to the October 1 closing high of $301.27, so the first Fibonacci supports are 23.6% at $283.48 and 38.2% at $272.47. Price is above both anchored VWAPs — $254.03 on the 90-day frame (anchored on the August 7 results gap) and $141.01 on the two-year frame.
② Volume

The October 2 session traded 3,673,600 shares, 1.367× the 20-day average of 2,686,835. The market as a whole was quiet that day (universe median 0.875×), so the market-adjusted figure is closer to 1.56×. Note that this above-average volume came on a down day (−2.22%), the session after the new closing high. Late September carried the heaviest volume of the quarter outside the August earnings spike, including the September 21–22 advance (+9.11% and +6.94%, tied to an AI-agent narrative and a run of analyst target increases) and the −7.96% drop on September 25. Volume in the last five sessions was above average but well short of a spike.
③ MACD

MACD is 18.22 against a signal line of 15.26, a histogram of +2.97, following a golden cross on September 17. That cross happened well above the zero line, which reads as a trend resumption rather than an early turn. The MACD line is at the top of its 90-day range, while the histogram bars have shrunk over the last few sessions compared with the late-September peak — momentum is still positive but no longer expanding. A fold back under the signal line would be the first sign that the late-September push is fading.
④ RSI

RSI is 65.74 — firm momentum, but below the 70 overbought line after briefly pushing above it in late September. No RSI divergence is flagged on either frame, so the new closing high on October 1 was matched by momentum rather than contradicted by it. The September 25 drop pulled RSI back into the low 60s instead of toward 50, which is consistent with a trend that is digesting gains. A move back through 70 together with a new high would mark the trend reasserting itself; a slide toward 50 would point to a deeper pullback.
⑤ Mansfield Relative Strength

Mansfield RS vs the S&P 500 is +67.20% and rising. It was +59.29% a week earlier and +45.29% a month earlier, so it gained 7.91 points over the week and 21.91 points over the month — positive and accelerating on both horizons. RS has stayed above zero for the entire 90-day window, and on the two-year panel it sits near its highest readings since early 2025. This is the strongest part of the setup: the stock has been outperforming the broad market by a wide margin and the gap is still widening.
⑥ ATR & ADX

ADX of 34.31 marks a strong trend, and it has been rising through September after a long stretch near 20. ATR is $14.10, or 4.79% of the price — near the top of its 90-day range after the late-September swings. The practical consequence is a wide risk reference: the 1×ATR level is $280.48 and the 2×ATR level is $266.39, 9.6% below the close. Position sizing has to account for that width; a tight stop inside normal daily noise would likely be triggered by an ordinary session.
⑦ OBV

OBV is in accumulation on both frames. On the two-year frame it stands 11.38% above its 20-day average and is rising; on the 90-day frame it is 21,048,800 against an average of 9,951,780 (+111.51%), also rising — the large percentage reflects the low 90-day starting base rather than a separate signal. No OBV divergence is flagged on either frame, so volume flow confirmed the move to new highs. The October 2 down day on above-average volume pulled OBV off its peak, which is worth watching if it repeats.
Bull vs Bear
Bull Case
- Close > SMA5 > SMA20 > SMA60; the full stack has held since September 15.
- Mansfield RS +67.20% vs the S&P 500, up 7.91 points week over week and 21.91 points month over month.
- ADX 34.31 — a strong trend, rising through September.
- OBV in accumulation on both frames with no divergence.
- The September 25 drop was recovered within four sessions to a new closing high ($301.27).
- Price above both anchored VWAPs: 90-day $254.03 and two-year $141.01.
Bear Case
- Extended: close well above SMA20 ($261.52) with Bollinger width at 44.19%.
- Wide risk: ATR 4.79% of price puts the 2×ATR reference 9.6% below the close.
- The October 2 decline came on above-average volume (1.367×) right after the 52-week high.
- MACD histogram shrinking from its late-September peak.
- Late-September gains were tied to a narrative and analyst target increases, which can reverse quickly.
- RSI 65.74 near the overbought zone after a 52-week high at $305.95.
Scenarios
| Scenario | Probability | Path | Trigger / Invalidation |
|---|---|---|---|
| Trend extends to new highs | 40% | The October 2 dip holds near SMA5 and price clears the $305.95 52-week high. | Trigger: close above $305.95 on volume above the 2,686,835 average, RSI through 70. Invalidation: close below the 23.6% level $283.48. |
| Deeper pullback inside the trend | 40% | The extension unwinds toward the $272.47–$263.58 Fibonacci zone and the rising SMA20 before the trend resumes. | Holds above SMA20 $261.52 with RS staying above zero; MACD stays above zero. |
| Trend breaks | 20% | Late-September gains fade and price falls back through the Fibonacci supports. | Close below the 2×ATR reference $266.39 followed by a loss of SMA20; MACD crosses below its signal. |
Key Levels
| Price | Role | Basis |
|---|---|---|
| $305.95 | Resistance | 52-week high (intraday) |
| $301.27 | Resistance | Closing high of Oct 1, 2026 · 0% of the Sep 8 → Oct 1 up-swing |
| $294.58 | Current | Close of Oct 2, 2026 · SMA5 $293.21 just below |
| $283.48 | Support | 23.6% retracement of the $225.89 → $301.27 swing |
| $272.47 | Support | 38.2% retracement of the same swing |
| $266.39 | Stop (2×ATR) | Objective invalidation, −9.6% from the close |
| $261.52 | Support | SMA20 / Bollinger mid-band (50% retracement $263.58 just above) |
Further below: the 90-day anchored VWAP at $254.03, the 61.8% retracement at $254.69, and the unfilled August 7 support gap at $194.99–$227.02. These are context rather than levels for the next two weeks.
What to Watch
- A close above $305.95. Clearing the 52-week high on above-average volume would confirm that the October 2 dip was a pause.
- Whether SMA5 ($293.21) holds. Price closed only slightly above it; repeated closes below would shift attention to the $283.48–$272.47 Fibonacci zone.
- Down-day volume. One higher-volume down session is noise; a run of them would challenge the accumulation reading in OBV.
- The MACD histogram at +2.97. Continued shrinking toward zero would warn that the September 17 cross is losing force.
- Mansfield RS at +67.20%. A flattening or drop below the prior-week +59.29% would be the first loss of relative leadership.
Conclusion
Past Analyses of This Stock same ticker · newest first
Other signals from this issue same publication date · 6 stocks
This analysis is an educational interpretation of chart data and is not investment advice. Probabilities and levels are subjective estimates; every investment decision, and its outcome, is your own responsibility. All figures are derived from closing-price data through October 2, 2026 and are not updated after publication.
Two Week Swing · twoweekswing.com · 4,600+ stocks screened weekly