Liquidity Services, Inc.
$43.23 −3.93% from 52-week high ($45.00)
This analysis is based on closing-price data as of October 2, 2026. Whether you're researching how to buy Liquidity Services, Inc. stock or you've just opened a brokerage account and are trying to time an entry, here are objective support levels and stop-loss references built from the RSI, MACD and ATR indicators.
Snapshot as of October 2, 2026 close
| Metric | Value | Read |
|---|---|---|
| Close | $43.23 | −3.93% from 52w high · +99.49% from 52w low |
| 52-week High / Low | $45.00 / $21.67 | Upper end of the annual range |
| SMA 5 / 20 / 60 | $43.27 / $42.83 / $41.30 | Bullish stack; close just under SMA5 |
| Bollinger (20) | $44.19 / $42.83 / $41.47 | Width 6.34% — compressed |
| aVWAP 90d (anchor Aug 6, 2026) | $42.37 | Price above — short-term buyers in profit |
| aVWAP 2y (anchor Dec 12, 2024) | $31.27 | Price well above — long-term holders in profit |
| RSI (14) | 55.57 | Neutral-positive · bearish divergence |
| Mansfield RS vs the Nasdaq Composite | +15.66% | Outperforming · slope falling |
| MACD / Signal / Hist | 0.482 / 0.503 / −0.021 | Dead cross Sep 30, 2026 |
| ADX (14) | 16.50 | Ranging (<20) |
| ATR (14) | $1.23 (2.86%) | Moderate volatility |
| OBV 2y / 90d | Early distribution / Distribution | Both below MA20 · bearish divergence |
| Volume vs 20d avg | 1.58x | On a down close (about 1.80x market-adjusted) |
| 1× / 2× ATR stop | $42.00 / $40.76 | −2.85% / −5.71% from close |
① Price & Moving Averages
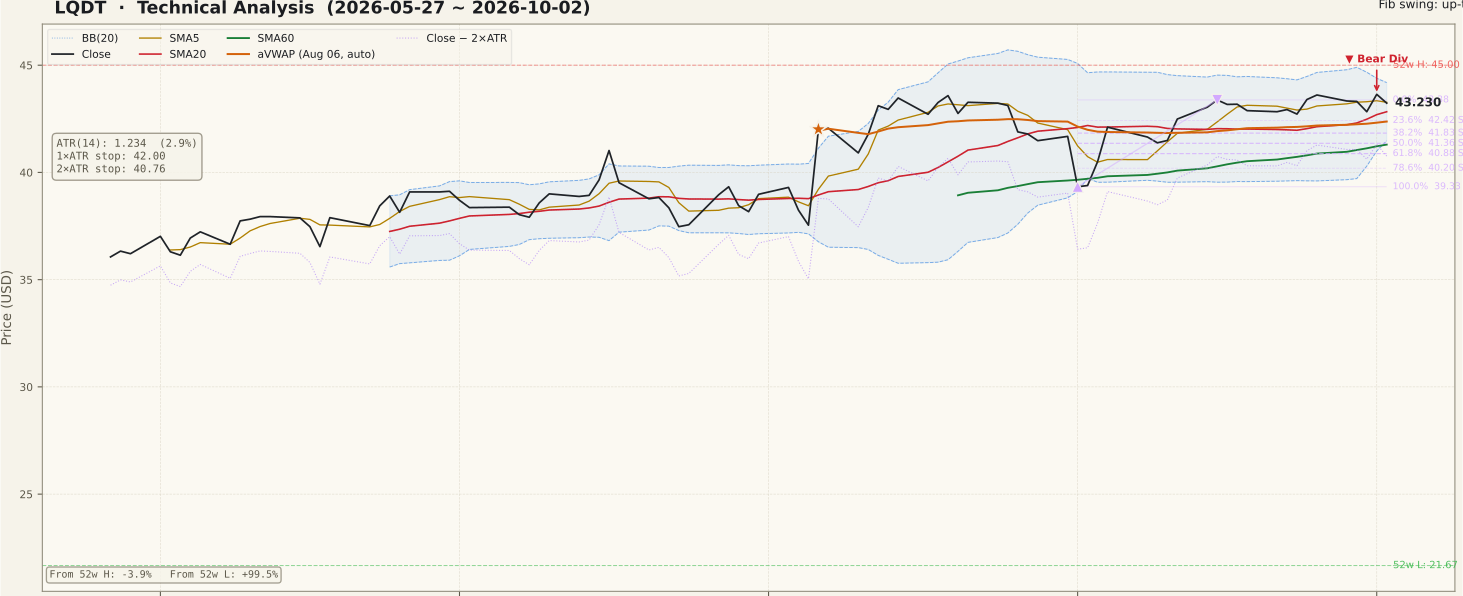
The two-year structure is a clear uptrend: price has climbed from the low $20s to the low $40s, and the 2-year anchored VWAP from December 2024 sits far below at $31.27. The current leg began with the August 6 jump of roughly +12% (an earnings-period session) that set the 90-day aVWAP anchor at $42.37; price has held above that line ever since apart from the early-September dip to $39.33. SMA5 crossed above SMA20 on September 14 to complete today's SMA5 > SMA20 > SMA60 alignment, on an ordinary +1.3% session at below-average volume — the alignment was not the product of a single event bar. On October 2 the stock gapped up and touched the 52-week high of $45.00 intraday, then gave it all back to close at $43.23, slightly below SMA5; the upper Bollinger Band at $44.19 and the $45.00 high now form the overhead ceiling, while SMA20/BB mid ($42.83) and the 90-day aVWAP ($42.37) are the nearest support shelf.
The 90-day Fibonacci grid is drawn on the September 1 low ($39.33) to September 15 close high ($43.38) swing; the 23.6% level ($42.42) and 38.2% level ($41.83) sit just above SMA60 ($41.30). The only unfilled gap on the 2-year chart is far below at $22.89–$25.08 (November 20, 2025) and is not relevant to the near-term map.
② Volume

Last session's volume was 373,400 shares, 1.58x the 20-day average of 236,855 — and with the broad U.S. market unusually quiet that day (median stock near 0.88x its own average), the market-adjusted figure is closer to 1.8x. That heavier volume came on a down close after the intraday test of $45.00, so it reads as supply meeting the high, not as confirmation of a breakout. The September 18 spike (about 2.8x on a small decline) was the quad-witching and S&P rebalance session, when volume was elevated market-wide, so it says little about LQDT specifically. Note that this is a thinly traded name (a few hundred thousand shares a day), so single-session volume reads can be noisy.
③ MACD

MACD is 0.482 against a signal line of 0.503, leaving a small negative histogram of −0.021 after a dead cross on September 30. The golden cross that preceded it (mid-September) produced only a shallow, flat histogram, far weaker than the August thrust when MACD ran well above 1.0. Both lines remain above zero, so this is a stall inside an uptrend rather than a bearish reversal, but momentum is clearly flattening rather than re-accelerating. A fresh golden cross with an expanding histogram would be the first sign the consolidation is resolving upward.
④ RSI

RSI is 55.57 — neutral-to-positive and nowhere near overbought. The JSON flags a bearish divergence: price made a marginally higher high ($43.58 on August 19 → $43.64 on October 1) while RSI made a lower high (66.35 → 61.05). That says the latest push to the top of the range carried less momentum than the August one. A divergence is a possibility of a top, not a confirmed top — it needs a follow-through break of support to matter — but it argues against assuming the next test of $45.00 will clear easily.
⑤ Mansfield RS vs the Nasdaq Composite

Mansfield RS is +15.66% vs the Nasdaq Composite, firmly in outperformance territory and positive throughout the 90-day window. Against one week ago (17.87) it is down 2.21 points — positive but slowing — while against one month ago (13.31) it is up 2.34 points, so the monthly trend of outperformance is still improving. The chart slope is flagged as falling, consistent with the weekly fade. Relative leadership is a genuine strength here; the watch item is whether the weekly slowdown turns into a steady decline.
⑥ ATR · ADX

ATR(14) is $1.23, or 2.86% of price, giving a 1× ATR reference of $42.00 and a 2× ATR reference of $40.76 (−5.71% from the close). ATR had drifted lower through September and ticked up at the end of the window with the wide October 2 range. ADX is 16.5, in ranging territory: the moving averages are aligned, but the market is not trending with any strength right now. That combination — aligned averages, low ADX, narrow Bollinger width — describes a coiled range whose direction has not yet been decided.
⑦ OBV

On-balance volume is the weakest panel. On the 90-day view OBV is in distribution — below its 20-day average and falling, 41.53% under that average (this is the gap to the MA20, not a divergence measure). On the 2-year view it is in early distribution, 4.83% below its MA20 with a flat slope. The JSON also records an OBV bearish divergence on the same two peaks as RSI: price $43.58 → $43.64 (August 19 → October 1) while 90-day OBV fell from 1,678,000 to 1,349,200 (2-year OBV 9,755,100 → 9,426,300). The heavy-volume down close on October 2 pushed OBV lower still. Volume flow is not confirming the price highs.
Bull Case vs Bear Case
Bull Case
- Bullish moving-average stack (SMA5 $43.27 > SMA20 $42.83 > SMA60 $41.30), formed on a non-event session.
- Within 3.93% of the 52-week high and up 99.49% from the 52-week low.
- Mansfield RS +15.66% vs the Nasdaq Composite, higher than a month ago.
- Price above both the 90-day aVWAP ($42.37) and the 2-year aVWAP ($31.27).
- Bollinger width compressed to 6.34% — a coil that often precedes expansion.
- RSI 55.57 leaves room before overbought; MACD still above zero.
Bear Case
- RSI bearish divergence: higher price high, lower RSI high (66.35 → 61.05).
- OBV bearish divergence and 90-day distribution, 41.53% below its MA20.
- MACD dead cross on September 30 with a flat, negative histogram.
- October 2 rejected the $45.00 high and closed lower on 1.58x volume.
- ADX 16.5 — no trend strength behind the aligned averages.
- RS slowed 2.21 points over the past week; thin share volume adds noise.
Scenarios
| Scenario | Probability | Path | Trigger / Invalidation |
|---|---|---|---|
| Range continues under the high | 45% | Price chops between roughly $42.4 and $45.0 while the divergences work off and the averages catch up. | Holds SMA20/BB mid $42.83 and the 90d aVWAP $42.37 · invalidated by a close below $41.83 |
| Pullback toward the SMA60 zone | 30% | Divergences resolve lower; price tests the 38.2–50% retracement band ($41.83–$41.36) and SMA60 ($41.30). | Close below $42.37 · trend structure breaks below the 2× ATR reference $40.76 |
| Breakout through $45.00 | 25% | Bollinger squeeze resolves upward; price clears the 52-week high with expanding volume. | Close above $45.00 on volume above average with a fresh MACD golden cross · fails if it closes back below $44.19 |
Key Levels
| Price | Role | Basis |
|---|---|---|
| $45.00 | Resistance | 52-week high (tested intraday Oct 2) |
| $44.19 | Resistance | Upper Bollinger Band |
| $43.23 | Current | Oct 2 close |
| $42.83 | Support | SMA20 / Bollinger mid |
| $42.37 | Support | 90-day aVWAP (anchor Aug 6) |
| $41.83 | Support | 38.2% retracement of the Sep 1–Sep 15 swing (SMA60 $41.30 just below) |
| $40.76 | Stop reference | 2× ATR below the close (−5.71%) |
What to Watch
- A daily close above $45.00 on above-average volume — the clean resolution of the range.
- Whether SMA20 ($42.83) and the 90-day aVWAP ($42.37) hold on any dip; losing both would favor the pullback scenario.
- OBV turning back above its 20-day average — needed to neutralize the volume divergence.
- MACD: a new golden cross with a widening histogram versus a deeper slide below the signal line.
- Mansfield RS: holding above +13% (last month's level) keeps relative leadership intact.
Conclusion
Past Analyses of This Stock same ticker · newest first
Other signals from this issue same publication date · 6 stocks
This analysis is an educational interpretation of chart data and is not investment advice. Probabilities and levels are subjective estimates; every investment decision, and its outcome, is your own responsibility. A bottoming signal is not a buy signal, and technical signals alone do not account for company fundamentals.
Two Week Swing · twoweekswing.com · 4,600+ stocks screened weekly