DHT Holdings, Inc.
$23.68 −0.2% from the 52-week high of $23.72 · +118.7% from the 52-week low of $10.83
This analysis is based on closing-price data as of October 2, 2026. Whether you're researching how to buy DHT Holdings, Inc. stock or you've just opened a brokerage account and are trying to time an entry, here are objective support levels and stop-loss references built from the RSI, MACD and ATR indicators.
DHT Holdings, an operator of very large crude carriers (VLCCs), has more than doubled off its 52-week low of $10.83 and closed the week at $23.68 — a 52-week closing high and just 0.2% under the intraday 52-week high of $23.72. The two-year picture is a steady 2025 climb, a sharp, high-volume surge in early 2026, a five-month sideways range, and a September breakout out of that range. The latest signal is a renewed close above the prior 20-day high on October 1 and 2, after a two-session pullback in late September. The move was shared across the crude-tanker group rather than specific to DHT, and the final session came on below-average volume, while RSI carries a flagged bearish divergence against the September 18 peak.
Snapshot all figures from the chart JSON · as of October 2, 2026
| Close | $23.68 |
|---|---|
| 52-week high / low | $23.72 (−0.2%) / $10.83 (+118.7%) |
| SMA5 / SMA20 / SMA60 | $22.83 / $22.12 / $19.87 — Close > SMA5 > SMA20 > SMA60, full bullish alignment |
| Bollinger (20) | Upper $23.82 · Mid $22.12 · Lower $20.42 · width 15.38% |
| aVWAP — 90d | $19.72 (anchor Jun 26, 2026) — price above |
| aVWAP — 2y | $18.75 (anchor Mar 2, 2026) — price above |
| RSI (14) | 70.4 — at the overbought line · bearish divergence flagged (Sep 18 $23.27 / RSI 78.56 → Oct 2 $23.68 / RSI 70.44) |
| Mansfield RS | +32.7% vs the S&P 500 · outperform · slope rising · prior week 22.92 · prior month 16.79 |
| MACD (12,26,9) | MACD 0.793 · Signal 0.740 · Histogram +0.053 · golden cross Oct 1, 2026 |
| ADX (14) | 27.4 — strong trend (direction-neutral) |
| ATR (14) | $0.82 — 3.4% of price |
| OBV — 2y / 90d | Accumulation, above MA20, slope rising in both frames (MA20 gap +37.01% 2y / +305.74% 90d) · no OBV divergence flagged |
| Volume | 3,512,800 shares — 0.82× the 20-day average of 4,294,215 (approx. 0.93× after adjusting for a quiet market session) |
| Stop references | 1×ATR $22.86 (−3.5%) · 2×ATR $22.05 (−6.9%) |
① Price & Moving Averages
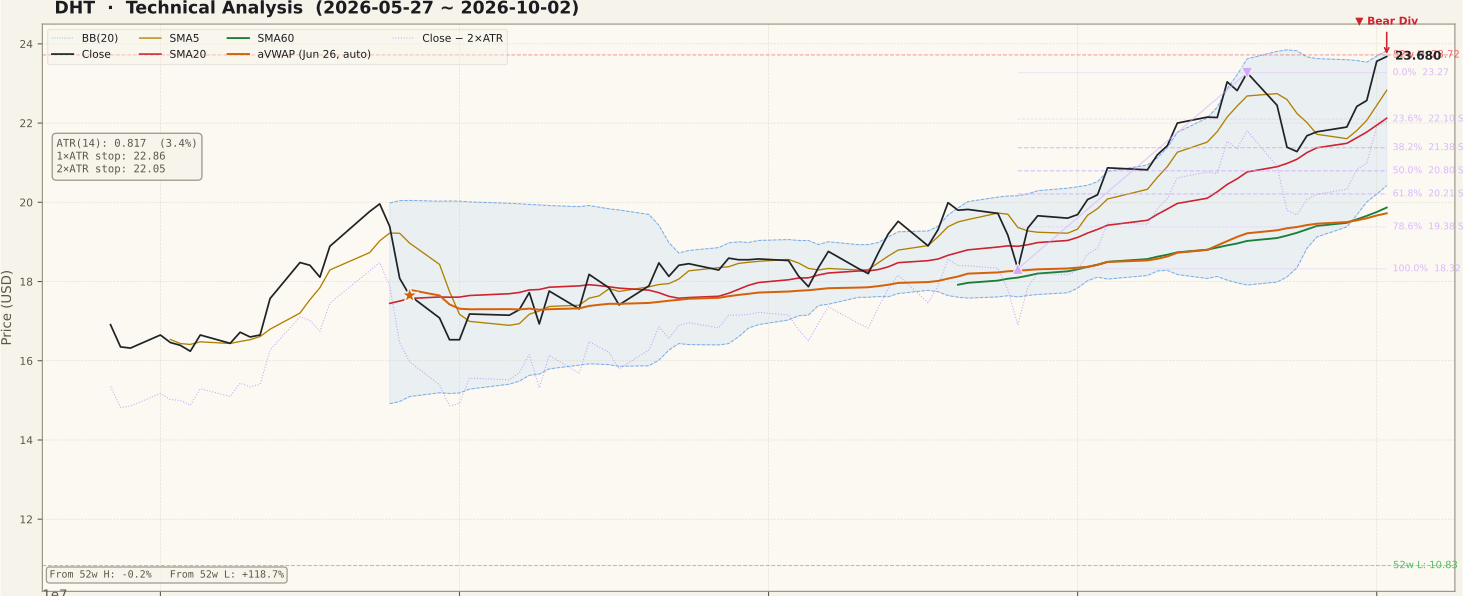
The moving-average stack is complete, and its parts are not new. Each condition has its own formation date: the close has held above SMA60 since July 20, and both SMA20 > SMA60 and the full SMA5 > SMA20 > SMA60 order have been in place since July 27. The close of $23.68 sits above SMA5 ($22.83), SMA20 ($22.12) and SMA60 ($19.87) — 7.0% above SMA20 and 19.2% above SMA60. What is new is the 20-day-high breakout: the stock closed above its prior 20-day high on October 1 and again on October 2.
The panel shows the route. An earlier run of 20-day-high closes from September 4 to September 18 carried the stock to $23.27, after which it gave back −3.52% on September 21 and −4.72% on September 22 and found its feet near the SMA20. The last five sessions (September 28 to October 2) were all up: +0.55%, +2.37%, +0.67%, +4.39% and +0.51%. Price now presses the upper Bollinger band ($23.82) with the bands at a moderate 15.38% width, and it sits well above the 90-day anchored VWAP at $19.72 (anchored June 26). On the two-year chart, the stock spent roughly March to August 2026 in a sideways range under the early-2026 peak; the September advance took it out of that range. The chart shows no unfilled gaps in either frame.
On the Fibonacci tool, the swing measured is the up-leg from the August 26 low of $18.32 to the September 18 high of $23.27. The close is now above that 0% anchor, so the retracement levels below — 23.6% at $22.10, 38.2% at $21.38, 50% at $20.80 — are pullback references rather than overhead levels.
② Volume

Volume is the softest part of this setup. The October 2 session traded 3,512,800 shares, 0.82× the 20-day average of 4,294,215. The market as a whole was quiet that day, but even after adjusting for it the figure is only about 0.93× — below average, not above. The larger session of the week was October 1 (+4.39%), which came on roughly 1.1× its average, a modest rather than emphatic confirmation.
The 90-day panel shows a steadier pattern underneath: volume through September generally ran near or somewhat above its 20-day average, and the two pullback days of September 21–22 did not come on any exceptional selling volume. The heavy-volume episode on the two-year chart is the early-2026 surge, not the current leg. A breakout that holds on sub-average participation is common, but it is less convincing than one that draws in new volume — a point the bear case leans on below.
③ MACD

MACD sits at 0.793 against a signal line of 0.740, with the histogram turning positive at +0.053. The last cross was a golden cross on October 1, 2026. Both lines are well above zero, so this is not an early-trend cross: it is a re-acceleration after the late-September pause, when MACD rolled over from its mid-September peak and dipped below the signal line.
The panel also shows that the new MACD high has not been made — the line is still below the level it reached around mid-September, even though price has moved higher. That mirrors the RSI divergence in the next section: momentum has turned back up, but it is not yet as strong as it was at the previous price peak. A histogram this small can flip back with one weak session.
④ RSI

RSI(14) stands at 70.4, right at the overbought threshold. The chart flags a bearish divergence: on September 18, price closed at $23.27 with RSI at 78.56; on October 2, price closed higher at $23.68 but RSI reached only 70.44. A higher price high on a lower momentum high is the classic shape of a fading push.
Treat it as a caution, not a verdict on direction. A divergence is a possibility of a turn, not a confirmed top; it needs follow-through — a failure back below the September high and the SMA20 — to mean more. It can also be erased if RSI pushes above its 78.56 reading on a further advance. Note that RSI held in the 50s during the September 21–22 pullback rather than slipping toward 40, which is consistent with a trend that paused rather than broke.
⑤ Mansfield Relative Strength

Mansfield RS is +32.7% vs the S&P 500, in outperform territory with a rising slope. It was 22.92 a week ago and 16.79 a month ago, so the reading has gained about +9.75 points in a week and +15.89 points in a month — positive and accelerating on both horizons. On the two-year chart RS has stayed above zero since early 2026, after a long stretch near or below zero through 2025.
The context matters: the September and October strength was shared across the crude-tanker group. Peers such as Hafnia, Nordic American Tankers, International Seaways, Frontline and Scorpio Tankers rose alongside DHT in the September 28 – October 2 window, and no DHT-specific catalyst was identified. That makes this relative strength a sector story as much as a stock story — it can persist while tanker sentiment holds, and it can fade for the whole group at once.
⑥ ATR & ADX

ATR(14) is $0.82, or 3.4% of price — a typical daily range for a shipping stock, and toward the upper end of this stock's own 90-day readings. That puts the 1×ATR reference at $22.86 (−3.5%) and the 2×ATR reference at $22.05 (−6.9%). The 2×ATR level sits just below the SMA20 ($22.12) and the 23.6% retracement ($22.10), so several references cluster in the $22.05–$22.12 zone.
ADX is 27.4, above the 25 line that separates a trending stock from a ranging one. It has climbed from below 20 in August, which says the September move developed into a genuine trend. ADX measures strength, not direction, and at 27.4 it describes a trend that is established but not stretched.
⑦ OBV

OBV reads accumulation in both frames: above its MA20 with a rising slope on the two-year chart (+37.01% vs MA20) and on the 90-day chart. The 90-day gap figure of +305.74% is large mostly because that window's OBV MA20 sits close to zero, which inflates the percentage — read it as "clearly above," not as a precise magnitude. No OBV divergence is flagged in either frame.
On the 90-day panel, OBV turned up in September from deep in negative territory and has reached a new high for the window this week, moving with price rather than lagging it. That is a supportive contrast to the RSI divergence: cumulative volume flow is confirming the higher close even though momentum is not, and even though the final session's raw volume was below average.
Bull Case vs Bear Case
Bull Case
- Full Close > SMA5 > SMA20 > SMA60 stack, in place since July 27.
- Renewed 20-day-high closes on October 1 and 2; 52-week closing high at $23.68.
- Mansfield RS +32.7% vs the S&P 500, up +9.75 points in a week and +15.89 in a month.
- MACD golden cross on October 1, with both lines above zero.
- OBV in accumulation and rising in both frames, with no OBV divergence.
- ADX 27.4 confirms a trending phase; price far above the 90d ($19.72) and 2y ($18.75) aVWAPs.
Bear Case
- RSI bearish divergence: $23.27 / 78.56 (Sep 18) vs $23.68 / 70.44 (Oct 2).
- Final breakout session on below-average volume: 0.82× (about 0.93× market-adjusted).
- The move is sector-wide with no DHT-specific catalyst identified, so it depends on tanker sentiment.
- Price at the upper Bollinger band ($23.82) and RSI at 70.4.
- 19.2% above SMA60 after an advance that has run since late August.
- The September 21–22 pullback (−3.52%, −4.72%) shows how quickly this stock can give back a week of gains.
Scenarios
| Scenario | Probability | Path | Trigger / Invalidation |
|---|---|---|---|
| Breakout extends | 40% | Price clears the $23.72 52-week high and the $23.82 upper band, with SMA5 rising underneath and RSI pushing toward or above its September reading. | Trigger: daily close above $23.72 on volume above the 4,294,215 20-day average. Invalidation: close back below the September 18 high of $23.27. |
| Pause and retest | 40% | The divergence plays out as a sideways-to-lower drift back toward the $22.10–$22.12 zone (23.6% retracement and SMA20), as in late September, with the trend structure intact. | Trigger: closes back under $23.27 with RSI below 70. Invalidation: a decisive close below the 2×ATR reference at $22.05. |
| Failed breakout | 20% | Tanker-group weakness pulls the stock through the SMA20 cluster toward the 38.2%–50% retracements ($21.38–$20.80). | Trigger: close below $22.05. Invalidation of this path: recovery and close above $23.27. |
Key Levels nearest to the close first, listed high to low
| Price | Role | Basis | Distance |
|---|---|---|---|
| $23.82 | Resistance | Upper Bollinger band | +0.6% |
| $23.72 | Resistance | 52-week high (intraday, October 2, 2026) | +0.2% |
| $23.68 | Current | Close of October 2, 2026 · 52-week closing high | — |
| $23.27 | Support | September 18 swing high (0% anchor of the $18.32 → $23.27 Fibonacci swing), now below the close | −1.7% |
| $22.86 | Support | 1×ATR reference | −3.5% |
| $22.12 | Support | SMA20 ($22.12) with the 23.6% retracement ($22.10) | −6.6% |
| $22.05 | 2×ATR stop | Objective invalidation reference, 2 × ATR $0.82 | −6.9% |
Below the stop reference: the 38.2% retracement at $21.38, the 50% at $20.80, the 61.8% at $20.21, SMA60 at $19.87, the 90-day aVWAP at $19.72, the two-year aVWAP at $18.75 and the August 26 swing low at $18.32.
What to Watch
- Volume on a close above $23.72. The final breakout session came on 0.82× average volume; a close through the 52-week high on volume above 4,294,215 shares would supply the confirmation that is missing so far.
- The RSI divergence. Whether RSI can exceed its September 18 reading of 78.56, which would erase the divergence, or rolls back under 70 while price stalls.
- The $23.27 September high. Holding above it keeps the breakout intact; slipping back under it would return the stock to its late-September range.
- The tanker peer group. Because the move was shared across crude-tanker names, the group's direction is likely to matter as much as DHT's own chart.
- The $22.05–$22.12 cluster. SMA20, the 23.6% retracement and the 2×ATR reference sit together; a decisive close below it would mark a change in the structure.
Conclusion
Past Analyses of This Stock same ticker · newest first
Other signals from this issue same publication date · 6 stocks
This analysis is an educational interpretation of chart data and is not investment advice. Probabilities and levels are subjective estimates; every investment decision, and its outcome, is your own responsibility. All figures are derived from closing-price data through October 2, 2026 and are not updated after publication.
Two Week Swing · twoweekswing.com · 4,600+ stocks screened weekly