DHT Holdings, Inc.
$20.87 −1.04% from the 52-week high · +92.71% from the 52-week low
This analysis is based on closing-price data as of September 4, 2026. Whether you're researching how to buy DHT Holdings, Inc. stock or you've just opened a brokerage account and are trying to time an entry, here are objective support levels and stop-loss references built from the RSI, MACD and ATR indicators.
DHT spent most of 2025 in a low base and then re-rated sharply in the first quarter of 2026, after which the tape went sideways for roughly six months between the June low near $16.24 and the June high near $19.96. The September 4 close of $20.87 clears the top of that range and sits just 1.04% under the 52-week high of $21.09, with the full moving-average stack in ascending order and Mansfield RS at +21.00% versus the S&P 500 and rising. The lens for the next two weeks is therefore a range-resolution test rather than a fresh-trend question: the structure is confirming, but ADX at 13.99 says trend strength has not yet caught up with price, so the honest read is a breakout that still needs a second close to prove itself.
Snapshot values as of the September 4, 2026 close
| Metric | Value | Read |
|---|---|---|
| Close | $20.87 | Highest close of the 90-day window |
| 52-week high / low | $21.09 / $10.83 | −1.04% from the high, +92.71% from the low |
| SMA 5 / 20 / 60 | $20.08 / $19.42 / $18.50 | Close > SMA5 > SMA20 > SMA60 — ascending stack |
| Bollinger (20) upper / mid / lower | $20.78 / $19.42 / $18.06 | Close above the upper band; width 14.0% |
| aVWAP — 90d (anchor Jun 15, 2026) | $18.55 | Price above the short-term anchor |
| aVWAP — 2y (anchor Mar 2, 2026) | $18.20 | Price above the long-term anchor |
| RSI (14) | 66.28 | Upper half, below the 70 overbought line |
| Mansfield RS vs the S&P 500 | +21.00% | Outperform, rising (prior week 14.87, prior month 11.14) |
| MACD / signal / histogram | 0.4696 / 0.3756 / 0.0940 | Golden cross on September 2, 2026 |
| ADX (14) | 13.99 | Ranging — trend strength not confirmed |
| ATR (14) | $0.69 (3.32% of price) | Volatility unit for position sizing |
| OBV — 90d / 2y | −12,715,300 / 53,053,800 | 90d accumulation & rising; 2y early accumulation, slope flat |
| Volume vs 20-day average | 5,255,800 vs 3,385,400 (1.55×) | Above-average participation into the breakout close |
| 1× / 2× ATR stop reference | $20.18 / $19.48 | 2× ATR sits 6.65% below the close |
① Price & Moving Averages
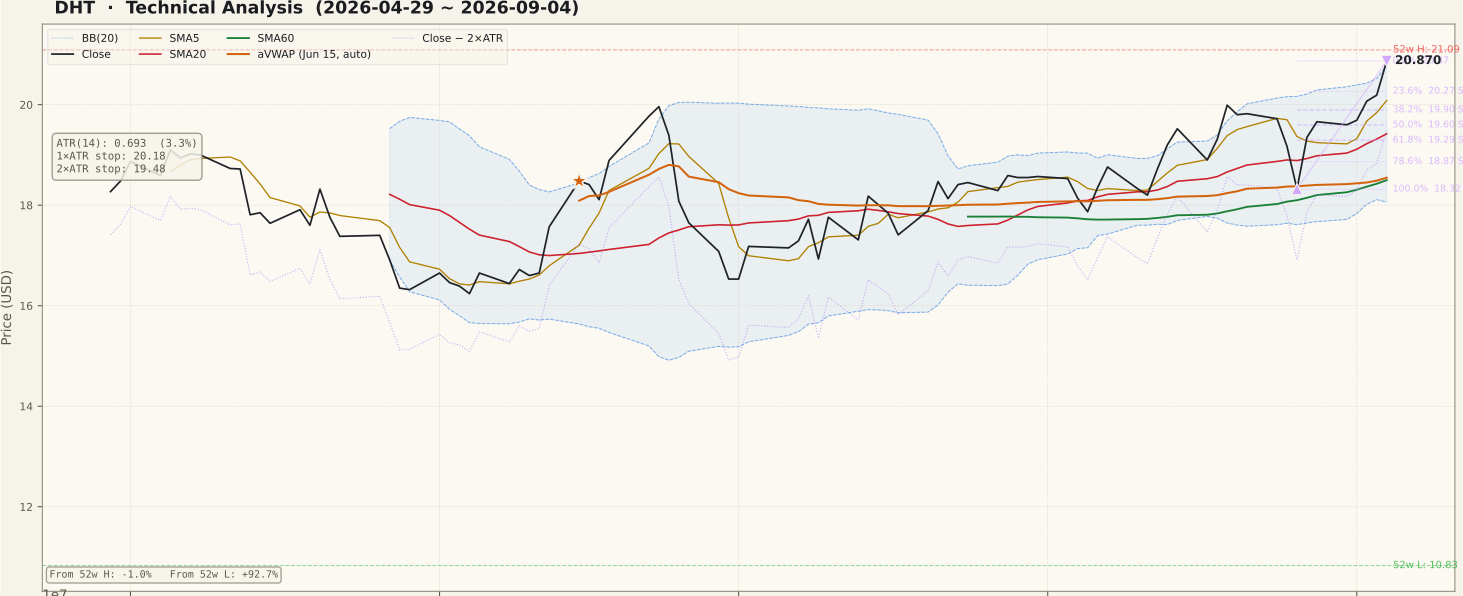
The moving averages are in full ascending order: the close of $20.87 sits above the SMA5 at $20.08, which sits above the SMA20 at $19.42, which sits above the SMA60 at $18.50. On the two-year panel the shape is a long flat base through late 2024 and most of 2025, a steep first-quarter 2026 advance, and then a wide six-month digestion between roughly $16.24 and $19.96 in which the SMA60 caught up to price from below rather than price falling back to it — the more constructive of the two ways a range can resolve.
The close also finished above the upper Bollinger band at $20.78, with band width at 14.0%. A close outside the band is a statement of momentum, not a level: it tells you the advance is running fast relative to its own recent distribution, and the mid-band at $19.42 is where such excursions usually get measured against. The 90-day Fibonacci anchor high is the September 4 close itself ($20.87, from the August 26 low of $18.32), which is a precise way of saying the current up-swing has not yet produced a pullback to judge — the 23.6% level at $20.27 and the 38.2% level at $19.90 are the first two places that judgement can be made. Neither timeframe carries an unfilled gap, so there is no overhead air pocket acting as a magnet in either direction.
② Volume

The September 4 session traded 5,255,800 shares against a 20-day average of 3,385,400 — a ratio of 1.55×. That is the right direction for a range breakout: the common beginner trap here is a new high printed on below-average turnover, and this is not that. It is also worth keeping the number in proportion. 1.55× is meaningful participation, not the 2×-plus spike the chart flags with a highlighted bar, and the 90-day panel shows those genuine spikes clustered in mid-to-late June rather than in the current advance.
The last five sessions carried no volume anomaly — turnover ran below its 20-day average for three of them before building into the close of the week — and the strongest session of the run was an advance of roughly three and a half percent, well inside normal range for a stock whose ATR is 3.32% of price. That advance was shared across crude and product tanker peers rather than isolated to this ticker, and no company-specific announcement was identified. The practical consequence is that the breakout should be read as a sector-level repricing that this chart participated in, not as a single-name event, which is a different and generally more durable thing to be leaning on.
③ MACD

MACD is at 0.4696 against a signal line of 0.3756, with the histogram positive at 0.0940 and the most recent crossover a golden cross dated September 2, 2026 — two sessions before the basis date. The cross happened above the zero line rather than deep beneath it, which matters for interpretation: a cross from well below zero is an early-recovery signal from a damaged tape, whereas a cross above zero inside an existing uptrend is a continuation signal from a tape that never lost its footing.
The 90-day panel also shows how often this indicator has changed its mind during the summer range. Several crossovers in both directions appear between July and August, and the histogram spent long stretches oscillating around zero. That is the expected behaviour of a trend-following oscillator inside a sideways market, and it is a reminder that the present cross earns its weight from the price structure around it — a new range high — rather than from the crossover itself.
④ RSI

RSI reads 66.28, in the upper half of its range but still short of the 70 overbought threshold, and the two-year panel gives essentially the same value at 66.27. The 90-day shape is a steady climb off the sub-30 readings of early June, through a brief touch of 70 in late June, then a long plateau in the low-to-mid 50s during the summer range and a fresh push higher over the past two weeks.
No RSI divergence is recorded on either timeframe — the field is null in both sidecars, and the chart's own summary reports none — so there is no oscillator-based warning about this high. That absence is informative in its own right: the most common failure mode at a range breakout is price making a higher high while RSI makes a lower one, and that is not the configuration here. Equally, 66 is not a cheap reading, and buying strength this far into a move means paying for the confirmation that a mid-range entry would not have required.
⑤ Mansfield Relative Strength

Mansfield RS versus the S&P 500 stands at +21.00% with a rising slope, and this is the strongest single element of the case. The prior-week reading was 14.87 and the prior-month reading was 11.14, so the weekly change is +6.13 and the monthly change is +9.86. Both are positive readings getting more positive — the positive-accelerating quadrant — which is the configuration you want to see confirming a breakout rather than following it.
The two-year panel puts that in context. RS was negative for most of 2024 and the first half of 2025, crossed above the zero line in early 2026, peaked near the mid-forties during the first-quarter advance, and then bled back toward single digits through the summer range without ever returning below zero. The current re-acceleration is therefore a second expansion from a base of relative outperformance, not a first crossing. Because Mansfield RS is anchor-free, the +21.00% value is identical on both timeframes, which is the consistency check this indicator is supposed to pass.
⑥ ATR & ADX

ATR is $0.69, or 3.32% of price, which sets the objective risk arithmetic: a 1× ATR reference sits at $20.18 and a 2× ATR reference at $19.48, the latter 6.65% below the close. Anyone sizing a position on this chart has to accept that a stop placed to survive normal daily noise must sit that far away, and size the position down accordingly rather than tightening the stop up into the noise.
ADX is the clearest counterweight in the whole picture: 13.99 on the 90-day frame and 13.68 on the two-year frame, both firmly in ranging territory below 20. ADX measures trend strength, not direction, so a low reading during an advance does not contradict the advance — it says the advance has not yet built the persistence that a trending tape shows. The two-year panel shows ADX peaking above 60 during the first-quarter surge and decaying steadily ever since, which is exactly what a six-month range does to it. A move back up through 20 would be the confirmation this breakout currently lacks.
⑦ OBV

The two timeframes carry different tags and both should be stated. On the 90-day frame OBV reads −12,715,300 against a 20-day moving average of −23,932,955, tagged accumulation, above its average with a rising slope, and 46.87% above that average. On the two-year frame OBV reads 53,053,800 against a 20-day average of 41,836,145, tagged early accumulation, above its average by 26.81%, but with a flat slope.
Read together, the message is that buying pressure has turned decisively over the recent window while the longer cumulative record is still only stabilising. That flat two-year slope is the honest caveat to the breakout: price has made a new high for the year, and cumulative volume flow across two years has not yet made a matching new high. Note also that the percentage figures above are the distance between OBV and its own 20-day average — a measure of how stretched accumulation is — and not a divergence reading. On the divergence question the sidecar records nothing on either timeframe, so there is no bearish non-confirmation to report and none should be inferred from the panel shape.
Bull Case vs Bear Case
Bull Case
- Full ascending stack — close $20.87 above SMA5 $20.08, SMA20 $19.42 and SMA60 $18.50, with the SMA60 rising into price rather than price falling to it.
- Mansfield RS at +21.00% versus the S&P 500 and rising, with a weekly change of +6.13 and a monthly change of +9.86 — positive and accelerating on both horizons.
- The close cleared the upper Bollinger band at $20.78 on 1.55× the 20-day average volume, so the range high was taken with above-average participation rather than on a thin tape.
- MACD golden cross dated September 2, 2026, printed above the zero line at 0.4696 versus a 0.3756 signal, with a positive 0.0940 histogram — a continuation configuration, not a recovery one.
- OBV sits above its 20-day average on both timeframes, tagged accumulation and rising on the 90-day frame.
- Price is above both anchored VWAPs — $18.55 from the June 15 anchor and $18.20 from the March 2 anchor — so buyers from both the short and long anchor points are in profit, which reduces overhead supply.
Bear Case
- ADX at 13.99 (90d) and 13.68 (2y) is squarely in ranging territory — trend strength has not confirmed what price is doing.
- The close is outside the upper Bollinger band at $20.78; band excursions frequently resolve back toward the mid-band at $19.42, which is 6.9% lower.
- RSI at 66.28 leaves only a narrow strip before the 70 threshold, so entries taken here are paying up for confirmation.
- The two-year OBV slope is flat while price makes a new high for the year — cumulative flow has not yet ratified the breakout on the longer frame.
- The 90-day Fibonacci anchor high is the close itself, meaning the current up-swing has produced no pullback to test; the swing's 100% level and last structural support is $18.32, some way below.
- Directly beneath price sits roughly six months of congestion between the June low of $16.24 and the June high of $19.96 — a failed breakout has a lot of range to fall back into.
Scenarios
| Scenario | Probability | Path | Trigger / Invalidation |
|---|---|---|---|
| Breakout holds | 50% | The first pullback is absorbed in the $20.27–$20.18 shelf, then the 52-week high at $21.09 is cleared, leaving no charted resistance directly overhead. | Trigger: a close above $21.09 with volume at or above the 3,385,400 20-day average. Invalidation: a close back below $19.90. |
| Range re-entry | 35% | The band excursion mean-reverts, price slips back inside the summer range and works down toward the 61.8% level at $19.29 and the SMA20 at $19.42. | Trigger: a close back below $19.60 (the 50% level). Invalidation: a reclaim and close above $20.27. |
| Structure breaks | 15% | The 2× ATR reference at $19.48 gives way, the ascending stack unwinds and the SMA60 at $18.50 and the 90-day swing low at $18.32 come into play. | Trigger: a close below $19.48. Invalidation: price holding above the SMA20 at $19.42. |
Key Levels
| Price | Role | Basis |
|---|---|---|
| $21.09 | Resistance | 52-week high — 1.04% above the close |
| $20.87 | Current | September 4, 2026 close; also the 0% anchor of the current up-swing |
| $20.78 | Support | Upper Bollinger band (20), now beneath price |
| $20.27 | Support | 23.6% retracement of the Aug 26 – Sep 4 up-swing |
| $20.18 | Support | 1× ATR reference below the close |
| $19.90 | Support | 38.2% retracement of the same up-swing |
| $19.48 | Stop reference | 2× ATR stop — 6.65% below the close |
What to Watch
- Whether the 52-week high at $21.09 is cleared on turnover at or above the 3,385,400 20-day average — a new high on thin volume would be the classic unconfirmed breakout.
- How the first pullback behaves in the $20.27–$20.18 shelf. Holding it keeps the breakout intact; slicing straight through it toward $19.90 turns the move into a band excursion.
- ADX lifting from 13.99 through 20. Until it does, the trend-strength reading disagrees with the price structure, and that disagreement is the main open question on this chart.
- Whether the two-year OBV slope turns from flat to rising. That would close the gap between a new price high and a cumulative-flow record that has not confirmed it.
- Whether Mansfield RS keeps expanding beyond +21.00%. A stall here after the +6.13 weekly gain would suggest the relative-strength impulse was a single sector-driven week rather than a new leg.
Conclusion
Past Analyses of This Stock same ticker · newest first
Other signals from this issue same publication date · 4 stocks
This analysis is an educational interpretation of chart data and is not investment advice. Probabilities and levels are subjective estimates; every investment decision, and its outcome, is your own responsibility. Chart readings describe what has already happened on the tape — they do not predict what happens next, and a bullish structure is not a buy signal.
Two Week Swing · twoweekswing.com · 4,600+ stocks screened weekly