Strive, Inc.
$30.09 −65.88% from the 52-week high of $88.20 · +328.63% from the 52-week low of $7.02
This analysis is based on closing-price data as of September 18, 2026. Whether you're researching how to buy Strive, Inc. stock or you've just opened a brokerage account and are trying to time an entry, here are objective support levels and stop-loss references built from the RSI, MACD and ATR indicators.
The two-year chart records a collapse and a base: a vertical spike to roughly $260 in May 2025, a year-long staircase decline into a flat $10–$15 shelf through the first half of 2026, and then a steep advance out of that shelf from mid-August. As of the September 18 close the stock trades at $30.09 with a full bullish moving-average stack, Mansfield RS of +45.07% against the Nasdaq Composite, and ADX at 54.8 — an established, strongly trending advance that first aligned on August 25. The defining tension is that the same chart sits 65.88% below its own 52-week high while RSI reads 78.6: this is a one-year relative-strength leader that is simultaneously deep in a multi-year repair job and extended in the short term. The lens for the rest of this page is therefore participation — the 20-day high was taken out on the base date itself, and the volume behind that single session does not confirm it.
Snapshot all values from the 90-day and 2-year JSON sidecars · as of September 18, 2026
| Metric | Value | Read |
|---|---|---|
| Close (Sep 18, 2026) | $30.09 | 20-day high taken out on this session |
| 52-week range | $7.02 – $88.20 | −65.88% from high |
| SMA5 / SMA20 / SMA60 | $28.48 / $25.15 / $16.62 | Close > 5 > 20 > 60 — aligned since Aug 25 |
| Bollinger (20) | $31.73 / $25.15 / $18.56 | Width 52.38% — expanded |
| aVWAP · 90d (anchor Aug 21, 2026) | $24.69 | Price above |
| aVWAP · 2y (anchor Jan 21, 2025) | $23.86 | Price above |
| RSI(14) | 78.61 (90d) · 78.59 (2y) | Overbought; divergence not available |
| Mansfield RS vs Nasdaq Composite | +45.07% | Outperform, slope rising |
| MACD (12,26,9) | 3.4225 / 3.3771 / +0.0453 | Golden cross Jul 7, 2026; histogram nearly flat |
| ADX(14) | 54.81 (90d) · 54.51 (2y) | Strong trend |
| ATR(14) | $1.88 (6.263% of price) | Wide daily range |
| OBV | 98,611,500 vs MA20 50,390,400 (90d) · 88,166,840 vs 39,945,740 (2y) | Accumulation, rising, on both frames |
| Volume (Sep 18) | 16,111,800 vs 20-day avg 11,430,645 = 1.41× | ≈0.80× once market-wide inflation is removed |
| Stop references | 1×ATR $28.21 · 2×ATR $26.32 | 2×ATR sits 12.53% below the close |
① Price & Moving Averages
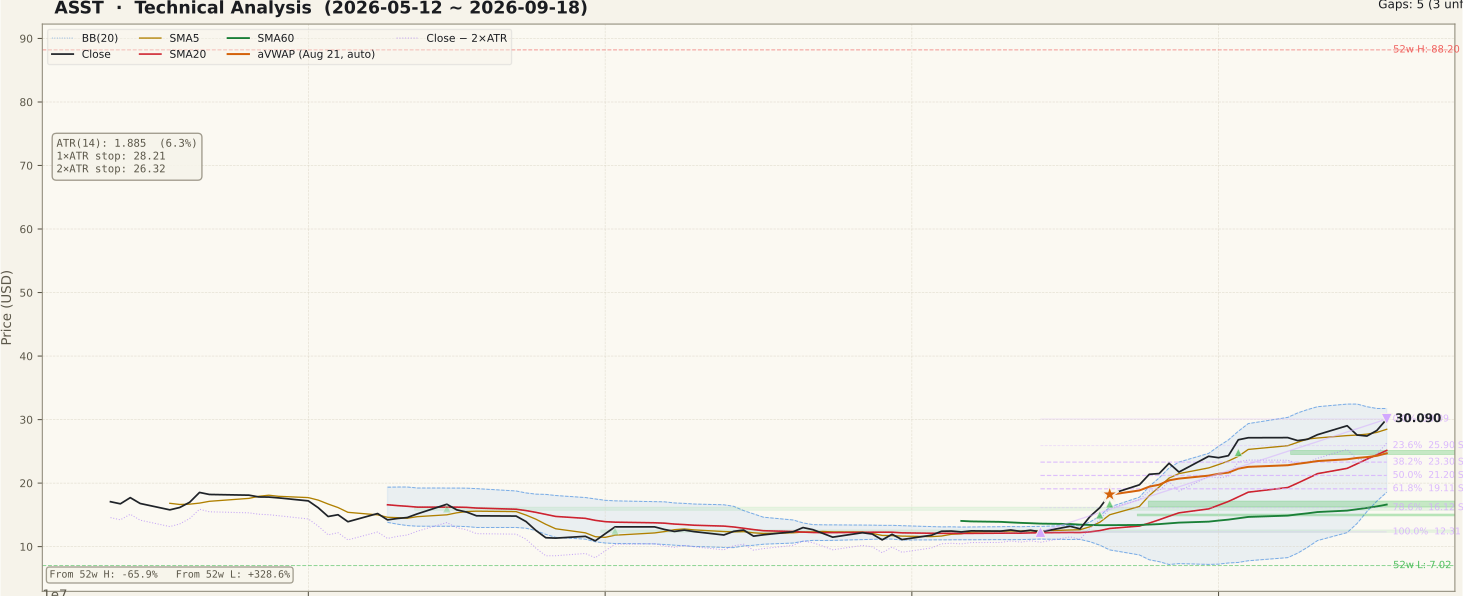
The 90-day panel is two different charts stitched together. From May through mid-August the close line runs sideways in a narrow band with the moving averages compressed on top of each other and the Bollinger Bands pinched tight. From late August the shape changes completely: price steps away from the pack, SMA5 and SMA20 fan out above a rising SMA60, and the bands open to a width of 52.38%. The structure at the base date is a textbook bullish stack — close $30.09 > SMA5 $28.48 > SMA20 $25.15 > SMA60 $16.62 — with price walking the upper band rather than reverting to the middle.
Dating that structure matters more than describing it. The full SMA5 > SMA20 > SMA60 alignment first became true on August 25 and has now held for eighteen consecutive sessions; the close has been above both SMA20 and SMA60 since August 19, twenty-two sessions. In other words the trend is not a Friday event. What is a Friday event is the breakout: the 20-day high was taken out on September 18 itself, so the highest-profile feature of this chart is exactly one session old while the trend underneath it is roughly a month old. Those two facts deserve different weights.
Extension is the cost of that structure. The close sits about 20% above SMA20 and about 81% above SMA60, and the upper Bollinger Band at $31.73 is only 5.5% overhead. Price is above both anchored VWAPs — $24.69 from the August 21 anchor and $23.86 from the January 21, 2025 anchor — which means buyers from both the recent leg and the long decline are, on average, above water; that reduces the supply of stock sold simply to get out even. The 90-day Fibonacci swing runs up from the August 14 low of $12.31 to the September 18 high of $30.09, putting the 23.6% retracement at $25.90 and the 38.2% at $23.30. Three unfilled gaps sit below as support — $24.50–$25.15 from September 3, $16.24–$17.18 from August 21 and $14.83–$15.14 from August 20. The two-year file's Fibonacci anchors ($260.20 high, $94.00 low, May 2025) and its unfilled resistance gaps at $157.80–$166.90 and $64.00–$66.00 are far above spot and carry no near-term relevance; they are a record of how far this chart fell, not levels in play.
② Volume

The volume panel shows quiet turnover through the summer base, then a dense cluster of bars flagged at two times average or more from late August into early September, and then a return to bars sitting close to the moving average. That cluster re-rated the baseline: the 20-day average volume is now 11,430,645 shares, so current bars are measured against a much higher bar than they were a month ago. The base-date session traded 16,111,800 shares, a ratio of 1.41× against that average, which at first glance reads as above-average participation confirming the 20-day high.
That first glance is wrong, and this is the single most important correction on the page. September 18 was quadruple witching and the S&P quarterly rebalance trade date (changes effective before the open on September 21), and the whole tape traded heavy as a result: the measured universe-wide median volume ratio for that session was 1.757× on a 398-ticker sample (1.730× across all 4,395 scanned rows), against 0.70×–0.98× on each of the prior twelve sessions. Measured against that tape, ASST's 1.41× is roughly 0.80× — below the market median. ASST was not part of the September index rebalance, so none of its volume is mechanical index demand; it simply traded lighter than everything around it.
The conclusion follows directly: the breakout to a 20-day high is not volume-confirmed. The four sessions before it ran at 0.98×, 1.03×, 0.72× and 0.88× of average, so relative participation has been flat to light for a week even as price moved. A new high on thinning relative participation is a caution flag, not a reversal signal — in an established markup, volume often fades between impulse legs. What would change the read is the opposite pairing: light volume on up sessions combined with heavy volume on a red session. That combination is not present in the data.
③ MACD

MACD reads 3.4225 against a signal line of 3.3771, a histogram of just +0.0453, with the last cross logged as a golden cross on July 7, 2026. (The two-year sidecar dates the same crossover to July 9 — a two-session difference from EMA seeding across different lookbacks, not a conflict in the signal.) MACD has now been above its signal line for roughly fifty sessions, which predates the price advance by weeks; the momentum turn was not manufactured by a single session.
The level and the shape matter more than the cross. Both lines sit far above zero for a stock that spent the summer pinned at zero, and on the panel the two lines have converged almost to a single line at the top of their range — the histogram has shrunk from clearly positive bars during the late-August impulse to something close to flat. Shrinking histogram bars above a rising signal line mean the rate of acceleration is easing, not that the trend has ended. With the histogram this close to zero, a dead cross is mechanically near: it would take only a few flat-to-down sessions. That would not by itself break the price structure, but it would remove momentum confirmation at the same moment the volume read is already missing.
④ RSI

RSI(14) is 78.61 on the 90-day frame and 78.59
on the two-year frame — firmly overbought, and per the panel sustained above 70 since late
August rather than spiking there in one session. The sidecar records
divergence: null with both peak fields null on both timeframes, so there is no
RSI divergence to report in either direction; the oscillator is simply pinned high.
The common beginner error here is to treat 78 as a signal in itself. In a strong trend RSI band-walks above 70 for extended stretches, and the ADX reading below is consistent with exactly that regime. The useful information is asymmetry: at this level the oscillator has very little room left to expand, so further upside has to come from price rather than from momentum re-rating, while a pullback that merely returns RSI toward 50 would imply a meaningful move down in price given an ATR of 6.263%. The configuration worth watching for is RSI losing 70 at the same time price loses SMA20 — neither has happened, and one without the other is noise.
⑤ Mansfield Relative Strength

Mansfield RS versus the Nasdaq Composite is +45.07%, state outperform, slope rising — and identical on both timeframes, as an anchor-free measure should be. ASST is Nasdaq-listed, so the benchmark is the Nasdaq Composite (^IXIC) and the panel label matches. The trajectory is the story: one week ago RS stood at 19.99 and one month ago at −45.25. That is a weekly change of +25.08 points and a monthly change of +90.32 points, placing the stock in the positive-and-accelerating quadrant on both horizons.
On the panel the line is flat near −75 for months, then rises almost vertically through the zero line in early September to its current reading. That cuts both ways. Constructively, Mansfield's framework treats the first sustained push above zero after a long negative stretch as the highest-value part of the signal, and a stock travelling from −45 to +45 against its index in a month is one the market has started to price differently. Cautiously, a reading built that fast is fragile — near-vertical RS tends to give back part of the move — and it is worth holding the two halves of this chart in mind at once: the same stock leading the index over one year is still 65.88% below its own 52-week high. Relative strength measures the race against the benchmark, not recovery of prior price.
⑥ ATR & ADX

ATR(14) is $1.88, or 6.263% of the close, and the panel shows it climbing steadily from its August trough as the advance developed — volatility expanded with the move rather than before it. ADX(14) at 54.81 is classified strong, and the two-year panel agrees at 54.51. ADX measures trend strength, not direction; here it confirms that the up-move has genuine directional persistence rather than being chop.
The practical consequence is position sizing. A stock whose average daily range is over six percent of price will routinely produce sessions that look alarming inside an intact trend, which is why the objective reference levels are scaled to ATR rather than to round numbers: 1×ATR sits at $28.21 and 2×ATR at $26.32, the latter 12.53% below the close. A 1×ATR stop here is inside normal daily noise. Note also that ADX above 50 is historically closer to a peak than a floor — readings that high tend to flatten or fall during consolidations, and a falling ADX from this level would indicate the trend pausing, not necessarily reversing.
⑦ OBV

OBV is tagged accumulation — above its 20-day moving average and rising — on both
timeframes, which is the constructive counterweight to the volume section above. The 90-day
reading is 98,611,500 against an MA20 of
50,390,400; the two-year reading is 88,166,840
against 39,945,740. The sidecar's divergence_pct fields
(95.7% on 90d, 120.72% on 2y) measure the
spread between OBV and its own moving average — that is a measure of how stretched accumulation
has become, not a divergence reading, and it should not be confused with one.
The actual divergence fields are obv.divergence: null with both peak fields null
on both frames, so no OBV divergence is confirmed in either direction. On the panel the line
spent the summer below zero and flat, then turned sharply higher from late August to sit at a
period high, tracking price rather than lagging it. That is the important structural point:
the cumulative volume record shows buying pressure that built through the whole advance, even
though the single breakout session itself was light relative to the market. The signal to
watch for is OBV flattening or rolling over while price makes further highs — a lagging OBV
at new price highs is the classic non-confirmation, and it is not present yet.
Bull vs Bear
Bull Case
- Full bullish stack: close $30.09 > SMA5 $28.48 > SMA20 $25.15 > SMA60 $16.62, aligned for 18 sessions
- Mansfield RS +45.07% vs the Nasdaq Composite, up 90.32 points in a month and 25.08 in a week
- ADX 54.81 — strong-trend classification on both timeframes
- OBV in accumulation, above MA20 and rising on both 90d and 2y, with no divergence flagged
- Price above both anchored VWAPs ($24.69 90d, $23.86 2y) — recent and long-term buyers are above water
- MACD above its signal line for roughly 50 sessions, far above zero — the momentum turn predates the price move
Bear Case
- The 20-day high is 1 session old and, adjusted for a 1.757× market, traded at only 0.80× relative volume
- RSI 78.61 — little oscillator headroom left
- Close roughly 20% above SMA20 and 81% above SMA60 — stretched from every reference
- MACD histogram down to +0.0453; a dead cross is only a few flat sessions away
- ATR 6.263% of price and Bollinger width 52.38% — expanded volatility usually contracts
- Still 65.88% below the 52-week high of $88.20, with no catalyst identified for the September 18 move
Scenarios
| Scenario | Probability | Path | Trigger / Invalidation |
|---|---|---|---|
| Breakout extends — band-walk continues | 35% | Price holds above $30.09 and works along the upper band toward $31.73, with SMA5 rising underneath. | Trigger: a second close above $30.09 on volume above the 11,430,645-share average, now that the tape has normalised. Invalidation: an immediate close back under $28.48. |
| Consolidation, then retest of the high | 45% | The one-session high is digested with a pullback into the $25.90–$23.30 retracement zone or the September 3 gap at $24.50–$25.15, RSI unwinds from 78 toward 60, then the trend resumes. | Trigger: SMA20 at $25.15 holding as support on lighter volume. Invalidation: a close below $23.30 that also breaks the SMA20. |
| Failed breakout — momentum unwinds | 20% | The unconfirmed high is sold back through the extension, MACD crosses down and price works toward the August gap cluster at $16.24–$17.18. | Trigger: a heavy-volume red session losing SMA20. Invalidation: recovery and close above $28.48. |
Key Levels
| Price | Role | Basis |
|---|---|---|
| $31.73 | Resistance | Upper Bollinger Band (20) |
| $30.09 | Current | Sep 18, 2026 close · 20-day high · 0% anchor of the 90-day up-swing |
| $28.48 | Support | SMA5 — first structural shelf under the breakout |
| $28.21 | Support | 1×ATR reference (inside normal daily noise) |
| $26.32 | 2×ATR stop | Objective invalidation — 12.53% below the close |
| $25.90 | Support | 23.6% retracement of the Aug 14 – Sep 18 swing |
| $25.15 | Support | SMA20 and Bollinger mid-band · upper edge of the Sep 3 unfilled gap ($24.50–$25.15) |
What to Watch
- Volume on the next up session. The witching and rebalance distortion is gone from September 22 onward, so the next above-average bar is a clean reading. A second close above $30.09 on genuine above-average volume would supply the confirmation Friday's session did not.
- SMA20 at $25.15. It doubles as the Bollinger mid-band and sits at the top edge of the September 3 gap. Holding it on a pullback keeps the month-old trend structure intact; losing it on volume changes the picture.
- The MACD histogram at +0.0453. It is close enough to zero that a cross could print within days. A dead cross while price holds above SMA20 is consolidation; a dead cross together with a loss of SMA20 is not.
- RSI losing 70. On its own an overbought reading is not informative in a strong trend. RSI dropping under 70 at the same time price loses the 20-day average is the pairing that matters.
- OBV relative to price. If price makes further highs while OBV flattens, the cumulative volume record stops confirming the advance — the classic non-confirmation, absent so far.
Conclusion
Past Analyses of This Stock same ticker · newest first
Other signals from this issue same publication date · 5 stocks
This analysis is an educational interpretation of chart data and is not investment advice. Probabilities and levels are subjective estimates; every investment decision, and its outcome, is your own responsibility. Chart readings describe structure that has already printed — they do not predict what comes next, and indicators can and do fail.
Two Week Swing · twoweekswing.com · 4,600+ stocks screened weekly