Skyworks Solutions, Inc.
$88.76 −3.84% from the 52-week high of $92.30
This analysis is based on closing-price data as of September 18, 2026. Whether you're researching how to buy Skyworks Solutions, Inc. stock or you've just opened a brokerage account and are trying to time an entry, here are objective support levels and stop-loss references built from the RSI, MACD and ATR indicators.
Skyworks spent most of the past two years as a laggard and bottomed at $51.93 before turning into one of the strongest names on the Nasdaq board: the stock closed Friday at $88.76, 70.92% above that 52-week low and only 3.84% below the 52-week high of $92.30. The moving-average stack is in full ascending order and Mansfield RS sits at +21.75% against the Nasdaq Composite. The complication is that the last five sessions were not a quiet drift — they were a string of double-digit swings driven by news flow around the company's pending acquisition of Qorvo, and Friday was itself a distorted tape. Read this page as a map of structure, with a discrete corporate event sitting inside the same two-week window the structure covers.
Snapshot all values as of the Sep 18, 2026 close
| Metric | Value | Reading |
|---|---|---|
| Close | $88.76 | Upper half of the 90-day range |
| 52-week high / low | $92.30 / $51.93 | −3.84% from high · +70.92% from low |
| SMA 5 / 20 / 60 | $86.99 / $75.52 / $67.88 | Close > 5 > 20 > 60 (ascending order) |
| Bollinger upper / mid / lower | $94.11 / $75.52 / $56.93 | Band width 49.24% of price — very wide |
| Anchored VWAP (90d, anchor Jul 29, 2026) | $73.24 | Price 21.2% above the short-term anchor |
| Anchored VWAP (2y, anchor Feb 6, 2025) | $67.75 | Price 31.0% above the long-term anchor |
| RSI (14) — 90d / 2y | 64.66 / 64.65 | Firm, below the 70 overbought line |
| Mansfield RS vs the Nasdaq Composite | +21.75% | Outperform, slope rising |
| MACD / signal / histogram | 5.84 / 4.24 / +1.60 | Golden cross on Sep 2, 2026; histogram positive |
| ADX — 90d / 2y | 30.32 / 30.00 | Strong trend reading (above 25) |
| ATR (14) | $4.94 | 5.56% of price — high volatility |
| OBV — 90d / 2y | 13,627,000 / 15,215,700 | Accumulation, above MA20, rising on both frames |
| Volume vs 20-session average | 22,112,400 vs 8,279,335 = 2.67x | Inflated by a market-wide event (see below) |
| 1x / 2x ATR stop reference | $83.82 / $78.89 | −5.56% / −11.12% from the close |
① Price & Moving Averages
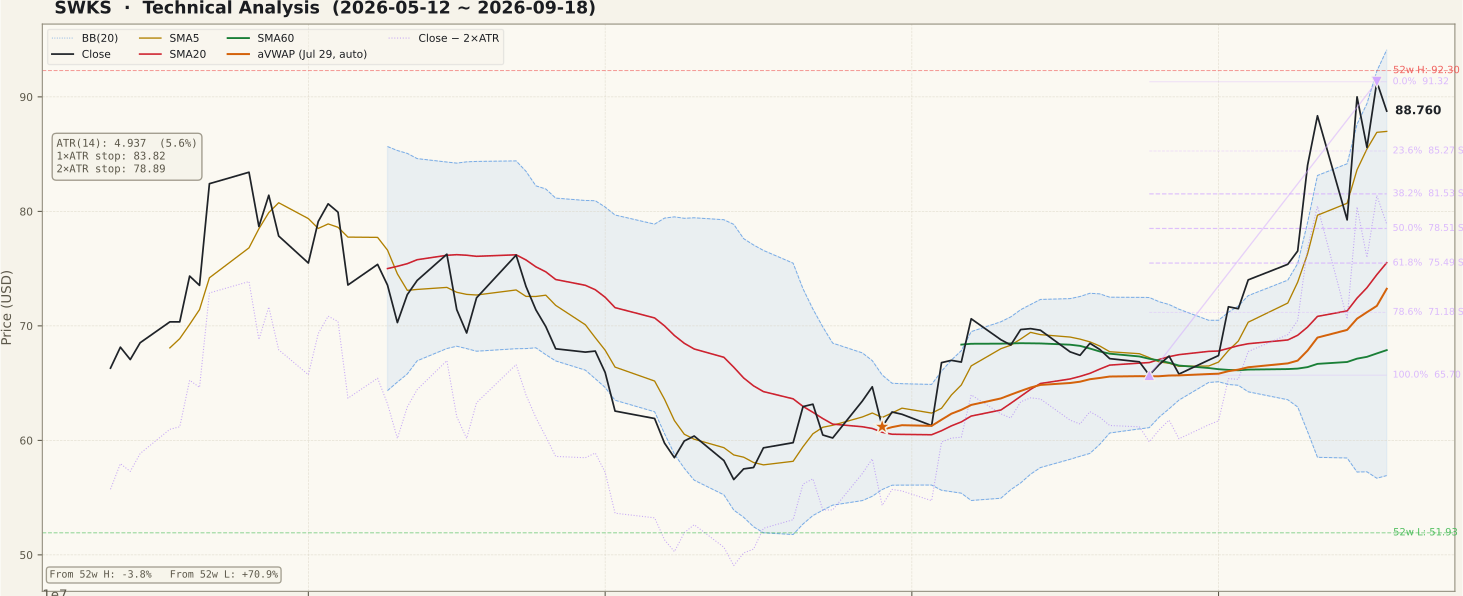
The moving-average stack is in full ascending order: close $88.76 above SMA5 $86.99, which is above SMA20 $75.52, which is above SMA60 $67.88. The distances are unusually wide — price sits 17.5% above the 20-day line and 30.8% above the 60-day line — which is what a trend looks like after a fast advance rather than after a steady climb. That ordering first became true on September 3, 2026 and has now held for eleven consecutive sessions; the close first cleared both SMA20 and SMA60 on September 2. Both dates precede the first news-driven surge of this run, so the structure was already in place before the headlines arrived.
The signal on this page is a pullback within that trend, and the pullback is shallow. Friday's close is 2.80% below the September 17 swing high of $91.32 — only 10.0% of the $65.70-to-$91.32 advance measured from the August 25 low. On the Fibonacci grid that keeps price above the 23.6% level at $85.27, with 38.2% at $81.53 and 50% at $78.51 beneath it. Bollinger context is equally stretched: band width is 49.24% of price, and the close sits about 71% of the way from the midline to the $94.11 upper band, so there is headroom but no band-walking.
Read the path, not just the endpoint. Price arrived next to its 5-day average through −10.29% (Sep 14), +13.55% (Sep 15), −4.90% (Sep 16), +6.69% (Sep 17) and −2.80% (Sep 18) — an average absolute daily move near 7.6%. That is a violent consolidation, not an orderly one. A chart reader who sees only "price near SMA5" and infers calm is reading the wrong thing here. The 90-day frame shows no unfilled gaps, and all four gaps recorded on the two-year frame have been filled, so there is no open gap acting as a magnet in either direction.
② Volume

Friday's 22,112,400 shares against a 20-session average of 8,279,335 gives a ratio of 2.67x in the data sidecar; the separate five-session scan run for this issue, measured on its own shorter baseline, put the raw figure at 3.01x. Either number overstates what actually happened at this stock, because September 18, 2026 was quadruple witching and the trade date for the S&P quarterly rebalance, with the index changes effective before the open on September 21.
That distortion is measurable rather than assumed. Across a 398-ticker sample the universe-wide median volume ratio on September 18 was 1.757x (1.730x across all 4,395 rows scanned), versus 0.70x to 0.98x on each of the twelve sessions before it. Dividing the stock's raw ratio by that market-wide inflation leaves a stock-specific reading of roughly 1.5x to 1.7x — elevated, but mild. It is not the three-fold participation surge the raw number implies. Skyworks was not among the September index additions or deletions, so none of the rebalance flow was directed at this name specifically.
The honest conclusion is a narrow one: Friday's volume confirms nothing. The sessions that do carry information are the two large moves earlier in the week — September 14 at 1.77x on a 10.29% decline and September 15 at 1.94x on a 13.55% advance — and both sit closer to twice the average than to three times it. A breakout attempt from here would need volume expansion measured against a clean post-witching baseline before it could be treated as confirmed.
③ MACD

MACD is at 5.84 against a signal line of 4.24, leaving the histogram positive at +1.60. The last crossover was a golden cross dated September 2, 2026, and both timeframes report the same date and essentially the same values, so there is no frame disagreement to resolve. The crossover happened far above the zero line, which is a different situation from the textbook early-cycle cross that occurs well below zero — here the momentum turn is a re-acceleration inside an advance that was already underway.
The spread between line and signal is wide in absolute terms, and that is the caution. A MACD this far extended above its own signal converges either by price pausing or by price falling; it does not stay stretched indefinitely. The September 2 cross date matters for a second reason: it is one of the three structural markers — alongside the September 2 close above SMA20 and SMA60 and the September 3 stack alignment — that all predate the first merger-driven session on September 10 by roughly a week.
④ RSI

RSI(14) reads 64.66 on the 90-day frame and 64.65 on the two-year frame — firm, in the upper band, but below the 70 line conventionally read as overbought. Given that price is within 3.84% of its 52-week high, an RSI in the mid-60s rather than the high-70s is worth noticing: the indicator has cooled while price has held near its highs, which is the arithmetic signature of a week in which large up days and large down days partially cancelled.
The sidecar reports rsi.divergence as null, with both peak fields null as well, so no regular
bullish or bearish RSI divergence is flagged for this window and none should be inferred from the shape of the
panel. That is the correct discipline here: with daily swings of this size, eyeballing peaks on the image
produces divergences that the measured series does not support. The practical reading is simply that momentum
has room in both directions — roughly 5 points of headroom to the overbought line, and roughly 15 points
of room down to the neutral 50 level that usually marks a trend's transition zone.
⑤ Mansfield Relative Strength

Mansfield RS is +21.75% against the Nasdaq Composite, state "outperform", slope rising, and the anchor-free construction gives the identical value on both timeframes as it should. This is the single strongest item on the page: the stock is not merely rising, it is rising faster than its benchmark index.
The four-quadrant check gives a split answer. The prior week's reading was 22.042, so the weekly change is −0.294 — positive territory with a slightly negative change, which is outperformance that is slowing, not deteriorating. The prior month's reading was −6.723, so the monthly change is +28.471, a very large positive swing: this name crossed from benchmark underperformance to substantial outperformance within a single month. Beginners often read a one-week dip in an RS line as a failure; the correct framing is that a marginal weekly stall inside a 28-point monthly improvement is noise, while the sheer speed of that monthly crossing is itself a caution, because moves achieved that quickly are rarely given back slowly.
⑥ ATR & ADX

ATR(14) is $4.94, which is 5.56% of the closing price. For a large-cap semiconductor name that is a high reading, and it is the number that should govern any position-size arithmetic on this chart: a single average session moves this stock about five and a half percent. ADX is 30.32 on the 90-day frame and 30.00 on the two-year frame, both comfortably above the 25 threshold that marks a strong trend. ADX measures strength, not direction, so it corroborates the ascending moving-average stack rather than predicting its continuation.
The practical consequence is the stop distance. A 1x ATR reference sits at $83.82, 5.56% below the close — which is inside a single average session's range and therefore likely to be touched by ordinary noise. The objective 2x ATR reference is $78.89, 11.12% below the close. That is a wide invalidation level, and it is wide for a reason: with last week's average absolute daily move near 7.6%, a tighter line would be removed by volatility rather than by any change in the trend. Anyone unwilling to hold through an 11% adverse excursion is looking at the wrong chart, not at the wrong stop.
⑦ On-Balance Volume

Both timeframes agree, which is worth stating explicitly because they often do not. The 90-day OBV reads 13,627,000, above its MA20 of 256,295, state "accumulation", slope rising. The two-year OBV reads 15,215,700, above its MA20 of 1,844,995, also "accumulation" and rising. Volume has been flowing to the upside on both the short and the long lens, and OBV is not lagging a price that is near its highs — the bearish non-confirmation pattern is absent.
Two cautions on the numbers. The reported divergence_pct values — 5,216.92% on 90 days and
724.70% on two years — are not divergences; they measure how far OBV sits from its own 20-period
moving average, and they inflate to extreme percentages whenever that moving average is near zero, which is
exactly the case here with a 90-day MA20 of 256,295. Treat them as "far above the average", nothing more
precise. Meanwhile the actual divergence fields, obv.divergence and both peak fields, are null on
both frames, so no OBV divergence is flagged. Separately, the last bar feeding these series is Friday's
witching-inflated volume, so a small part of the current OBV extension is mechanical rather than informational.
Bull Case vs Bear Case
Bull Case
- Full ascending stack — close $88.76 > SMA5 $86.99 > SMA20 $75.52 > SMA60 $67.88, held for 11 consecutive sessions since Sep 3.
- Mansfield RS +21.75% versus the Nasdaq Composite with a rising slope, a swing of +28.47 points from last month's −6.72.
- MACD 5.84 above signal 4.24 with a +1.60 histogram, golden cross dated Sep 2, 2026.
- OBV in accumulation, above MA20 and rising on both the 90-day and two-year frames — no bearish non-confirmation.
- The pullback is shallow: only 10.0% of the $65.70–$91.32 advance retraced, holding above the 23.6% level at $85.27.
- ADX 30.32 confirms genuine trend strength rather than a drift, and price is 21.2% above the 90-day anchored VWAP of $73.24.
Bear Case
- Last five sessions moved −10.29%, +13.55%, −4.90%, +6.69%, −2.80% — an average absolute daily move near 7.6%, not an orderly consolidation.
- The Sep 15 advance of +13.55% was driven by reporting on merger regulatory progress, not by company operating results.
- A pending $22B acquisition of Qorvo is in the final stage of China's review and may close within the calendar year — a binary event inside this page's two-week structural window.
- Friday's 2.67x volume is not stock-specific confirmation: the universe-wide median was 1.757x on quadruple-witching and S&P rebalance day, leaving roughly 1.5x–1.7x adjusted.
- Price is 17.5% above SMA20 and 30.8% above SMA60; mean reversion toward either line would be a large drawdown from here even with the trend intact.
- ATR at 5.56% of price forces an 11.12% objective invalidation distance, and the stock is only 3.84% below its 52-week high of $92.30 — poor structural room above, expensive risk below.
Scenarios
| Scenario | Probability | Path | Trigger / Invalidation |
|---|---|---|---|
| Trend continuation | 40% | Holds above SMA5 $86.99 and the 23.6% level $85.27, reclaims the Sep 17 swing high $91.32 and tests the 52-week high $92.30, with the $94.11 upper Bollinger band as the next reference. | Trigger: a close above $91.32 on volume expansion measured against a post-witching baseline. Invalidation: a close back below $85.27. |
| Wide-range consolidation | 35% | Chops between roughly $81.53 (38.2% level) and $91.32 while the SMA20 at $75.52 catches up, working off the 17.5% extension without breaking structure. | Trigger: repeated failures near $91.32 with RSI easing from 64.66 toward 50. Invalidation: a decisive close outside either boundary. |
| Event-driven reversal | 25% | A merger headline or a deal-close announcement resets the price, losing $85.27 and then the 50% level $78.51, with the $78.89 stop reference and the SMA20 region below. | Trigger: a high-volume close below $83.82 (1x ATR). Invalidation: an immediate reclaim of $86.99 within one or two sessions. |
Key Levels
| Price | Role | Basis |
|---|---|---|
| $92.30 | Resistance | 52-week high |
| $91.32 | Resistance | Sep 17, 2026 swing high · 0% of the swing |
| $88.76 | Current | Sep 18, 2026 close |
| $86.99 | Support | SMA5 — the pullback reference for this signal |
| $85.27 | Support | 23.6% retracement of the $65.70–$91.32 advance |
| $83.82 | Support / 1x ATR | 1x ATR below the close (−5.56%) — inside normal noise |
| $78.89 | 2x ATR stop | Objective invalidation, −11.12% from the close |
What to Watch
- The first clean volume session. Friday's tape was distorted by quadruple witching and the S&P rebalance. Volume from Monday, September 21 onward is the first honest read on whether participation is still elevated at this stock or only was at the index level.
- Whether $85.27 holds. The 23.6% retracement is the line separating a shallow pullback from a deeper retracement toward the 38.2% level at $81.53 and the 50% level at $78.51.
- Merger news flow. The Qorvo transaction is in the final stage of China's regulatory review and management has indicated it is preparing to close within the calendar year, possibly within the fiscal year ending September 30. A closing announcement is a discrete event that can reprice the stock in a single session regardless of chart structure.
- RS behaviour on any pullback. Mansfield RS at +21.75% is already slowing week-on-week (−0.294). If it keeps falling while price holds, the stock is quietly losing its edge over the Nasdaq Composite even without a visible price break.
- Whether the swings compress. An average absolute daily move near 7.6% is not sustainable. Narrowing daily ranges while price holds above SMA5 would be constructive; continued 10% swings mean the chart is being driven by headlines, not by structure.
Conclusion
Past Analyses of This Stock same ticker · newest first
Other signals from this issue same publication date · 5 stocks
This analysis is an educational interpretation of chart data and is not investment advice. Probabilities and levels are subjective estimates; every investment decision, and its outcome, is your own responsibility. Skyworks Solutions, Inc. is subject to a pending merger transaction and to news-driven price moves that technical indicators cannot anticipate; chart signals alone are not a sufficient basis for a purchase decision in such a stock.
Two Week Swing · twoweekswing.com · 4,600+ stocks screened weekly