Strive, Inc.
$27.62 −86.0% from the 52-week high · +293.4% from the 52-week low
This analysis is based on closing-price data as of September 11, 2026. Whether you're researching how to buy Strive, Inc. stock or you've just opened a brokerage account and are trying to time an entry, here are objective support levels and stop-loss references built from the RSI, MACD and ATR indicators.
Two years of data show a stock that fell almost the entire length of its range — the 52-week band runs from $7.02 to $197.60, and the close sits 86.0% below that high. What has changed is the last three weeks: price is now above a rising 5/20/60 moving-average stack, ADX at 51.2 reads as a strong trend, and Mansfield RS has crossed from roughly −61 a month ago to +20.0% today. That is a genuine momentum turn measured against the Nasdaq Composite, but it is a turn off a deeply broken multi-year chart, with RSI at 81.7 and the close 28% above its own 20-day average — this is a late-stage reading of an advance, not an early one.
Snapshot values as of September 11, 2026 close
| Metric | Value | Read |
|---|---|---|
| Close | $27.62 | Two-year data range 2024-09-13 → 2026-09-11 |
| 52-week high / low | $197.60 / $7.02 | −86.0% from high · +293.4% from low |
| SMA 5 / 20 / 60 | $27.10 / $21.49 / $15.44 | Bullish alignment: close > 5 > 20 > 60 |
| Bollinger (20) upper / mid / lower | $32.03 / $21.49 / $10.95 | Band width 98.09% — heavily expanded |
| aVWAP — 90-day (anchor Aug 21, 2026) | $23.47 | Price above the short-term anchor |
| aVWAP — 2-year (anchor Jan 21, 2025) | $23.66 | Price above the long-term anchor |
| RSI (14) | 81.7 | Overbought; no divergence recorded |
| Mansfield RS vs Nasdaq Composite | +20.0% | Outperform · rising (prev week 4.87, prev month −60.84) |
| MACD (12,26) / signal / histogram | 3.60 / 3.19 / +0.41 | Golden cross Jul 7, 2026; histogram still positive |
| ADX (14) | 51.2 | Strong trend (strength, not direction) |
| ATR (14) | $1.86 (6.72% of price) | High volatility — size positions accordingly |
| OBV — 90-day / 2-year | Accumulation, above MA20, rising / Accumulation, above MA20, rising | Both timeframes agree; OBV-vs-MA20 spread 364.62% / 785.78% |
| Volume vs 20-day average | 0.89× (8,905,500 vs 10,055,370) | Latest session below average |
| 1× / 2× ATR stop reference | $25.77 / $23.91 | 2× ATR sits 13.4% below the close |
① Price & Moving Averages
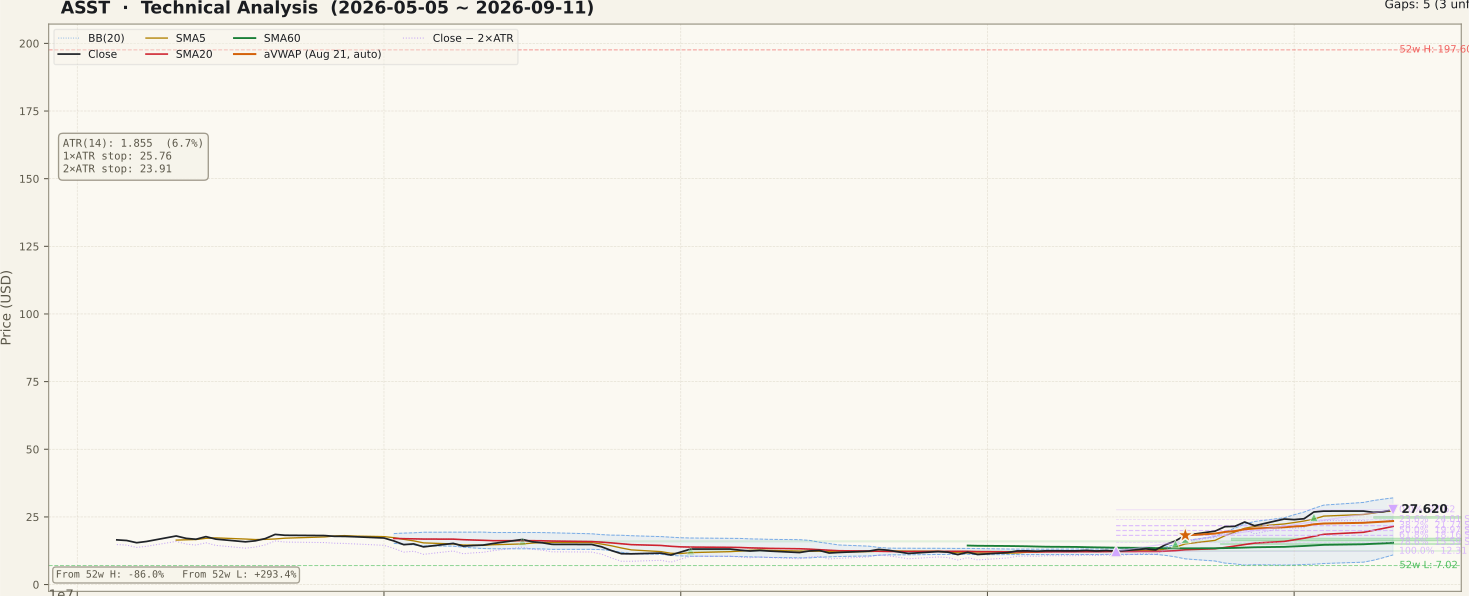
The moving-average stack is in textbook bullish order: close $27.62 above SMA5 $27.10, above SMA20 $21.49, above SMA60 $15.44. The gaps between them are unusually wide — the close is roughly 28% above its 20-day average and 79% above its 60-day average, which is what a vertical re-rating looks like rather than a steady trend. Bollinger band width of 98.09% confirms the expansion, and price is walking the upper half of a band whose ceiling sits at $32.03.
Both anchored VWAPs — $23.47 from the August 21, 2026 anchor and $23.66 from the January 21, 2025 anchor — sit below the current price and happen to cluster within twenty cents of each other, so buyers on both horizons are in profit and that zone is the first structural place a pullback would be tested. The 90-day Fibonacci swing is measured up from the August 14, 2026 low of $12.31 to the September 11 high of $27.62; the 23.6% retracement at $24.01 and the 38.2% at $21.77 are the nearest retracement supports. Three unfilled gaps sit underneath as support — $24.50–$25.15 from September 3, $16.24–$17.18 from August 21, and $14.83–$15.14 from August 20. The two-year Fibonacci anchors ($260.20 high, $94.00 low, May 2025) and the two unfilled resistance gaps at $157.80–$166.90 and $64.00–$66.00 are so far above spot that they carry no near-term relevance — they are a record of how far this chart fell.
② Volume

The 90-day volume panel shows the profile of a base that woke up: months of quiet turnover well under the 20-day average, then a dense cluster of sessions flagged at two times average or more from late August through early September. That cluster is what dragged the 20-day volume average up to 10,055,370 shares — the baseline itself has re-rated, so today's bars are being measured against a much higher bar than they were a month ago.
The as-of session traded 8,905,500 shares, a ratio of 0.89× against that average. Price made a new high for the move on below-average volume, which is the classic signature of an advance running on thinner participation. That is a caution flag, not a reversal signal: in an established markup, volume routinely fades between impulse legs. What would change the read is below-average volume on the way up paired with above-average volume on a red session — that combination marks distribution, and it is not present yet.
③ MACD

MACD reads 3.60 against a signal line of 3.19, a positive histogram of +0.41, with the last cross logged as a golden cross on July 7, 2026. (The two-year series dates the same cross to July 9 — a two-session difference from EMA seeding across different lookbacks, not a conflict in the signal.) The cross therefore predates the price advance by several weeks, which is a point in the trend's favour: the momentum turn was not manufactured by a single session.
The important detail is the level, not the cross. Both lines are far above zero for a stock that spent the summer near zero, and the histogram — while still positive — is visibly narrower than its peak earlier in the run. Shrinking histogram bars above a rising signal line mean the rate of acceleration is easing, not that the trend is over. A dead cross from this altitude would be a material warning; a flat histogram alone would only be consolidation.
④ RSI

RSI(14) is 81.7 on the 90-day frame and 81.7 on
the two-year frame — deep into overbought territory and, per the chart, sustained above 70 for
roughly two weeks rather than a single spike. The JSON records divergence: null with
both peak fields null, so there is no bearish RSI divergence to report; the oscillator is simply
pinned high.
A common beginner error here is to read 80+ as a sell signal. In a strong trend RSI band-walks above 70 for extended stretches, and the ADX reading below supports that interpretation. The useful information is asymmetry of risk: at this level the oscillator has almost no room to expand further, so upside from momentum alone is capped while a pullback that merely returns RSI to 50 would imply a meaningful drawdown in price. The signal worth waiting for is RSI losing 70 while price simultaneously loses the 20-day average — neither has happened.
⑤ Mansfield Relative Strength

Mansfield RS vs the Nasdaq Composite is +20.0%, state outperform, slope rising — and identical on both timeframes, as an anchor-free measure should be. The prior readings make the trajectory the story: one week ago RS stood at 4.87 and one month ago at −60.84. That is a weekly change of +15.11 points and a monthly change of +80.83 points, placing the stock firmly in the positive-and-accelerating quadrant.
The zero-line crossing is recent, which cuts both ways. On the constructive side, a stock moving from −61 to +20 against its index in a month is one that institutions have started to treat differently, and Mansfield's framework treats that first push above zero after a long negative stretch as the highest-value part of the signal. On the cautious side, a reading built that quickly is fragile: RS that steepens vertically tends to give back a portion of the move, and a drop back below zero would invalidate the outperformance case outright regardless of what the price pattern looks like.
⑥ ATR & ADX

ADX(14) at 51.2 is classified strong — well past the 25 threshold and among the higher readings a liquid stock produces. ADX measures trend strength, not direction, so it should be paired with the price panel: here the direction is up, so a high ADX corroborates the advance. It also carries a warning that experienced readers respect — ADX above roughly 50 is historically closer to trend exhaustion than trend inception, because the strength has already been expressed.
ATR(14) is $1.86, or 6.72% of price, and the panel shows it climbing steadily through the advance rather than settling. Position sizing has to be built off that number: a 1× ATR reference is $25.77 and a 2× ATR reference is $23.91, which is 13.4% below the close. Anyone using a tighter stop than roughly six or seven percent on this chart is placing it inside a single average day's range, where normal noise will remove the position regardless of whether the thesis was correct.
⑦ OBV

Both timeframes tag OBV as accumulation, above its 20-day moving average and rising — agreement between the 90-day and two-year views, which is not always the case. On the 90-day frame OBV is 80,355,200 against an MA20 of 17,294,785; on the two-year frame it is 71,085,565 against 8,025,150. The panel shows OBV crossing from negative territory to a new high for the period in late August, which means the volume that accompanied the advance arrived predominantly on up sessions.
Two clarifications matter. First, the JSON records divergence: null with both OBV
peak fields null, so there is no OBV divergence — bullish or bearish — to report. Second, the
divergence_pct figures of 364.62% and
785.78% are not divergence readings: they measure the spread
between OBV and its own 20-day average, and they inflate to extreme percentages whenever that
average sits near zero, which is exactly the case after a sign flip. Read them as "OBV has pulled
far away from its baseline," not as a percentage of anything tradable.
Bull vs Bear
Bull Case
- Full bullish alignment — close $27.62 > SMA5 $27.10 > SMA20 $21.49 > SMA60 $15.44.
- Mansfield RS +20.0% and rising, up +80.83 points in a month — a decisive move from underperform to outperform vs the Nasdaq Composite.
- ADX 51.2 classified strong, confirming the advance is a trend rather than a drift.
- OBV in accumulation on both timeframes, above MA20 and rising — the advance was volume-backed.
- MACD golden cross dated July 7, 2026 with the histogram still positive at +0.41 — the momentum turn predates the price move.
- Price above both anchored VWAPs ($23.47 and $23.66), so buyers on both horizons are in profit and less likely to be forced sellers.
Bear Case
- RSI 81.7 — deeply overbought with essentially no headroom left on the oscillator.
- Close is roughly 28% above SMA20 and 79% above SMA60; mean reversion alone implies a large drawdown.
- ATR at 6.72% of price means a correct thesis still requires tolerating double-digit swings.
- Newest high came on 0.89× average volume — the advance is thinning, not broadening.
- Bollinger width 98.09% is an extreme expansion; bands this wide historically precede contraction, not further widening.
- Structurally the chart remains 86.0% below its 52-week high, with unfilled resistance gaps at $64.00–$66.00 and $157.80–$166.90 — this is a rebound inside a broken multi-year picture.
Scenarios
| Scenario | Probability | Path | Trigger / Invalidation |
|---|---|---|---|
| Trend continuation — band-walk holds | 40% | Price continues to ride the upper Bollinger half toward the $32.03 band ceiling, with SMA5 $27.10 acting as the running floor. | Trigger: a close above $27.62 on volume at or above the 10,055,370-share average. Invalidation: a close back below SMA5. |
| Retracement, then resumption | 40% | Momentum unwinds into the $24.01 (23.6%) to $21.77 (38.2%) retracement zone, where the two aVWAPs at $23.47/$23.66, the September 3 gap at $24.50–$25.15 and SMA20 $21.49 cluster. | Trigger: RSI losing 70 while the SMA5/SMA20 order stays intact. Invalidation: a close below $21.49, which breaks the retracement zone's floor. |
| Momentum failure | 20% | The advance reverses back toward the August gap cluster at $16.24–$17.18 and $14.83–$15.14, with SMA60 $15.44 inside that band. | Trigger: Mansfield RS falling back below zero, or a high-volume close beneath the 2× ATR reference of $23.91. Invalidation: price reclaiming SMA20 with the histogram turning positive again. |
Key Levels
| Price | Role | Basis |
|---|---|---|
| $32.03 | Resistance | Upper Bollinger Band (20) — band width 98.09% |
| $27.62 | Current close · Resistance | September 11, 2026 close and the 0% anchor of the 90-day up-swing |
| $27.10 | Support | SMA5 — the running floor of the current advance |
| $25.77 | Support | 1× ATR reference below the close |
| $25.15 – $24.50 | Support | Unfilled gap dated September 3, 2026 |
| $24.01 | Support | 23.6% retracement of the Aug 14 → Sep 11 swing; aVWAP cluster $23.47/$23.66 just beneath |
| $23.91 | 2× ATR stop | Objective invalidation — 13.4% below the close |
What to Watch
- Volume on new highs. The as-of session printed 0.89× average. Fresh highs need volume at or above 10,055,370 shares to confirm; repeated highs on lighter turnover argue the advance is narrowing.
- The Mansfield RS zero line. RS crossed to +20.0% only recently after a month at −60.84. A slide back under zero removes the single strongest element of the bull case.
- MACD histogram direction. Currently +0.41 and narrowing. A move to negative from this altitude — well above zero — would be the first mechanical sign the advance is rolling over.
- The $23.47–$23.66 aVWAP shelf. Both anchors sit within twenty cents of each other, immediately above the 2× ATR reference at $23.91. How price behaves there separates a healthy retracement from a failed one.
- Bollinger contraction. Band width of 98.09% is unsustainable. Watch whether contraction resolves as a sideways pause holding SMA20 $21.49, or as a downside resolution.
Conclusion
Past Analyses of This Stock same ticker · newest first
Other signals from this issue same publication date · 5 stocks
This analysis is an educational interpretation of chart data and is not investment advice. Probabilities and levels are subjective estimates; every investment decision, and its outcome, is your own responsibility. Technical readings describe what price and volume have already done — they do not forecast news, earnings or corporate events.
Two Week Swing · twoweekswing.com · 4,600+ stocks screened weekly