Agenus Inc.
$7.85 −11.3% from the 52-week high of $8.85 · +189.7% from the 52-week low of $2.71
This analysis is based on closing-price data as of September 18, 2026. Whether you're researching how to buy Agenus Inc. stock or you've just opened a brokerage account and are trying to time an entry, here are objective support levels and stop-loss references built from the RSI, MACD and ATR indicators.
Over two years this is a stock that fell to $2.71 and has since tripled off that low, and its Mansfield relative strength of +67.3% against the Nasdaq Composite is the single strongest reading on this page — that one-year measure of leadership is the reason the stock appears in this week's screen at all. The near-term picture is much thinner than the relative-strength number suggests. The close of $7.85 moved back above both SMA20 ($7.63) and SMA60 ($6.36) on the base date itself, September 18, and it got there on a single +8.73% session for which no catalyst could be identified. SMA5 ($7.31) is still below SMA20, MACD ($0.081) is still below its signal line ($0.166), and the stock has not broken its 20-day high. So the honest description is a long-running outperformer that has just reclaimed its moving averages, with the short-term structure not yet confirmed — and this page keeps those two statements separate rather than blending them into one story.
Snapshot all figures from the chart JSON · as of September 18, 2026
| Close | $7.85 |
|---|---|
| 52-week high / low | $8.85 (−11.3%) / $2.71 (+189.7%) |
| SMA5 / SMA20 / SMA60 | $7.31 / $7.63 / $6.36 — close above SMA20 and SMA60, but SMA5 is below SMA20, so the 5>20>60 alignment is not established |
| Bollinger (20) | Upper $8.64 · Mid $7.63 · Lower $6.63 · width 26.25% |
| aVWAP — 90d | $6.61 (anchor Jul 13, 2026) — price above |
| aVWAP — 2y | $5.41 (anchor Apr 22, 2025) — price above |
| RSI (14) | 57.5 — above the 50 midline, below 70 · no RSI divergence flagged |
| Mansfield RS | +67.3% vs the Nasdaq Composite · outperform · slope tagged falling · prior week 50.19 · prior month 68.78 |
| MACD (12,26,9) | MACD 0.081 · Signal 0.166 · Histogram −0.085 · dead cross Aug 10, 2026, not yet reversed |
| ADX (14) | 30.2 — strong trend (direction-neutral) |
| ATR (14) | $0.53 — 6.7% of price |
| OBV — 2y / 90d | Early accumulation, above MA20, slope flat in both frames · spread vs own MA20: 2.33% (2y) / 2.49% (90d) · no OBV divergence flagged in either frame |
| Volume | 2,084,000 shares — 2.20× the 20-day average of 948,020 (see the volume section: the market-wide session was itself inflated) |
| Stop references | 1×ATR $7.32 (−6.7%) · 2×ATR $6.80 (−13.4%) |
① Price & Moving Averages
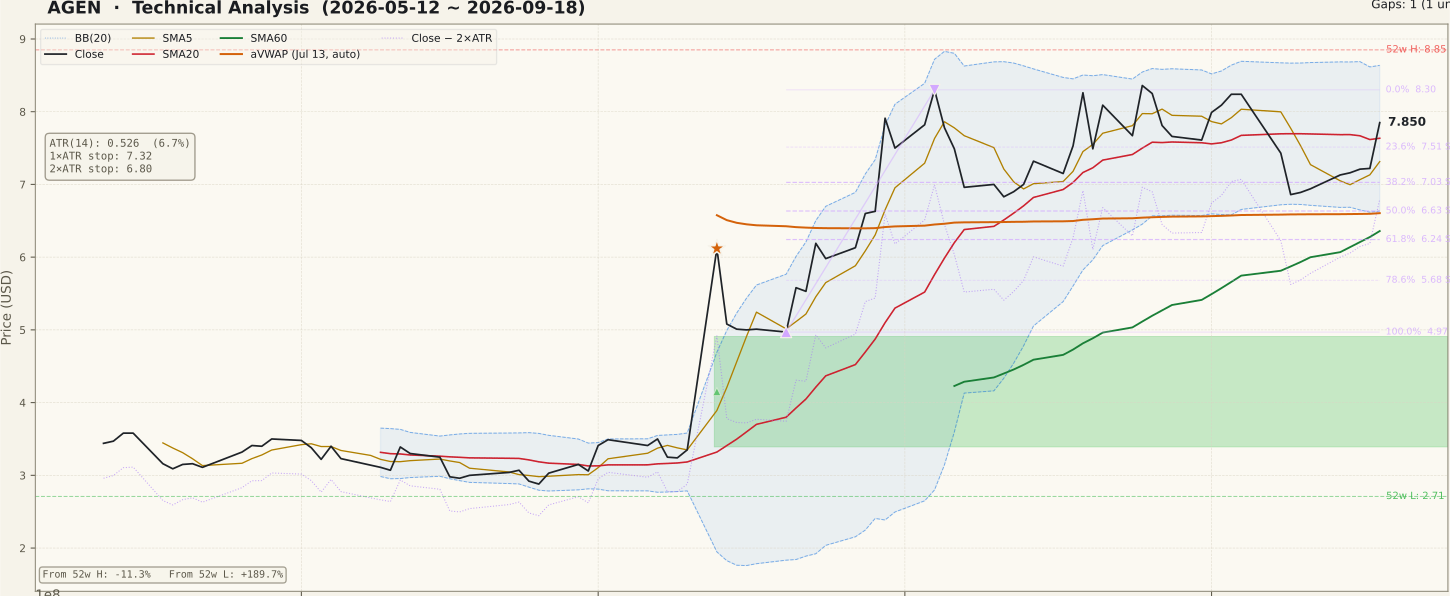
This is a partial stack, not a bullish one, and the distinction matters. The close of $7.85 is above SMA20 ($7.63) and well above SMA60 ($6.36), but SMA5 ($7.31) sits below SMA20 — the short-term average has not yet turned up through the intermediate one, so the textbook SMA5 > SMA20 > SMA60 alignment does not exist on this chart. The close first rose back above both SMA20 and SMA60 on September 18, the base date itself, which means this reclaim is one session old. The stock has also not broken its 20-day high. On the panel the shape is a sharp V: a July low near $4.97 on July 20, a run to $8.30 on August 4, a slow drift back, and then a two-step drop on September 8 and 9 that took the close from $8.24 to $6.86 before the recovery to $7.85.
Those two September sessions — −9.83% and −7.67% back to back — fall outside the five-session review window and carry no shock flag, but they are the most important context on this panel: the stock is still trading below its September 4 close. What looks like a breakout on the last bar is, in structural terms, a partial repair of that decline. Bollinger Bands are moderately wide at 26.25%, with the close just above the mid-band ($7.63) and the upper band at $8.64 — roughly 10% of headroom before the bands would constrain an advance. Price sits above both anchored VWAPs, the 90-day at $6.61 (anchored July 13, 2026) and the two-year at $5.41 (anchored April 22, 2025), so buyers from either anchor are collectively above water; that reduces overhead supply but says nothing about the last week's move.
② Volume

The final bar reads 2,084,000 shares against a 20-day average of 948,020 — a ratio of 2.20× in the sidecar (2.26× on the raw session measurement). Taken at face value that looks like conviction behind the +8.73% advance. It is not, and this is the single most important correction on the page. September 18, 2026 was quadruple witching and also the trade date for the S&P quarterly rebalance, with the index changes effective before the open on September 21. Measured across the screened universe, the median volume ratio that session was 1.757× — against 0.70× to 0.98× on each of the twelve sessions before it. In other words the whole market traded roughly 1.76 times its normal size that day for calendar reasons.
Dividing the stock's raw ratio by that market-wide inflation leaves a stock-specific ratio of roughly 1.29× — ordinary participation. September 18 was therefore not a high-volume day for this stock, and the price move happened without an unusual amount of trading behind it. Agenus was not part of the September index rebalance, so none of the excess is index-driven demand for these shares specifically. The four sessions before it traded at 0.72×, 0.77×, 0.68× and 0.77× the 20-day average — quiet, and consistent with the small scale of the name (market capitalisation around $320M, 20-day average turnover about $7.3M). A breakout attempt on ordinary volume is the classic unconfirmed breakout, and it is the reason this page treats the reclaim as provisional.
③ MACD

MACD reads 0.081 against a signal line at 0.166, leaving the histogram at −0.085. The last crossing was a dead cross on August 10, 2026, and it has not been reversed — through the whole September decline and the September 18 rebound, MACD has stayed beneath its signal line. There is no momentum crossover on this chart, and any reading of the last bar that implies one is wrong. Both lines are only marginally above zero, which is what a stock that has round-tripped a swing looks like: the fast and slow averages have converged near their crossing point.
The constructive detail is narrow and worth stating plainly: the histogram gap of 0.085 is small relative to the swings visible earlier on the panel, so the distance to a bullish crossing is not large. But a narrowing histogram is a precondition, not an event. Until MACD closes back above 0.166 the momentum picture is still the one set on August 10. Readers who take a converging histogram as an early cross routinely get the direction right and the timing badly wrong, because convergence resolves in both directions roughly as often as not.
④ RSI

RSI(14) sits at 57.5 — above the 50 midline, comfortably below the 70 overbought threshold. For a stock that just added 8.73% in a session, a mid-range RSI is itself informative: the September 8–9 decline pulled the oscillator down far enough that a single large up-day only returned it to the upper half of the range. There is no exhaustion reading here, and equally no oversold bounce signature — the panel shows a reset rather than an extreme.
The JSON reports rsi.divergence as null, with both peak fields null as well,
so no RSI divergence is flagged in this frame and none is asserted. That is a genuinely
neutral reading, and neutral is the correct label. RSI crossing back above 50 is often cited as the moment
momentum turns, but on its own it confirms only that the recent up-closes outweigh the down-closes; here
that balance is dominated by one session, which is exactly the kind of single-bar dependence that makes an
RSI reading fragile.
⑤ Mansfield Relative Strength

Mansfield RS reads +67.3% versus the Nasdaq Composite (the correct benchmark for a Nasdaq listing), state "outperform", firmly above the zero line. This is the strongest element of the case and the reason the stock surfaced in the screen: over the measurement horizon it has beaten its index by a wide margin. Relative strength is anchor-free, so the two-year and 90-day panels agree on the same +67.3% figure — the leadership is not an artefact of the window chosen.
The rate of change tells a more mixed story, and both halves belong on the page. Against the prior week's 50.19 the reading is +17.07 points higher — positive territory and accelerating, which is the September 18 session showing up in the measure. Against the prior month's 68.78 it is 1.53 points lower — positive territory but slowing, and the JSON separately tags the slope as falling. Those are not contradictory: relative strength eroded through the early-September decline and then snapped back in the final week, so the month-over-month comparison is still slightly negative while the week-over-week one is strongly positive. A leadership reading this high is a real advantage, but it is a one-year measure and it does not certify the last five sessions.
⑥ ATR & ADX

ATR(14) is $0.53, or 6.7% of price — high in absolute terms, and a reminder that an average day in this stock moves about two thirds of a percent more than most listed names move in a week. That figure drives the stop arithmetic directly: a 1×ATR reference sits at $7.32 (−6.7%) and the objective 2×ATR reference at $6.80 (−13.4%). Position sizing has to start from that 13.4% distance, not from a comfort level; a stop placed any nearer than roughly $7.32 is inside a single average session's range and will be taken out by noise.
ADX(14) reads 30.2 — above the 25 threshold, state "strong". ADX measures the strength of a trend and not its direction, so a high reading here is a statement that the move off the $2.71 low has been persistent rather than a statement that the next move is up. The same indicator read high on the way down in early September. The practical reading is that this is a stock which, once it commits to a direction, tends to keep going — which cuts in both directions from a close sitting on its own mid-band.
⑦ OBV

On-balance volume is in the same state on both timeframes, which is worth noting because the two frequently disagree. The 90-day frame shows OBV at 176,156,100 against an MA20 of 171,873,890 — a spread of 2.49% above its own average — and the two-year frame shows 188,433,300 against 184,151,090, a spread of 2.33%. Both are tagged early accumulation, both are above their MA20, and the slope in both is flat. So accumulation is present but shallow and not currently steepening.
Two cautions. First, that spread figure is the distance between OBV and its own 20-day average — a measure
of accumulation intensity — and is not a divergence. The sidecar reports obv.divergence as
null in both frames, with both peak fields null, so no OBV divergence is
flagged and none is claimed here. Second, a flat OBV slope alongside a +8.73% price session is
exactly what the volume analysis predicted: with only ordinary stock-specific participation behind the
move, there was not enough volume in it to bend the accumulation line. Price rose; the accumulation
measure barely noticed.
Bull Case vs Bear Case
Bull Case
- Mansfield RS +67.3% vs the Nasdaq Composite — sustained one-year outperformance, and the same figure in both frames.
- Week over week RS rose from 50.19 to 67.26 (+17.07 points) — positive and accelerating.
- Close $7.85 back above SMA20 ($7.63) and SMA60 ($6.36) as of the base date.
- Price above both anchored VWAPs — 90d $6.61 and 2y $5.41 — so neither anchor cohort sits on a loss.
- OBV above its MA20 in both frames (+2.49% / +2.33%), tagged early accumulation.
- RSI 57.5 with no divergence flagged, and ADX 30.2 confirming that trends here tend to persist.
Bear Case
- The 5>20>60 alignment does not exist — SMA5 $7.31 is below SMA20 $7.63.
- MACD 0.081 is below signal 0.166, histogram −0.085; the August 10 dead cross stands.
- Adjusted for the market-wide 1.757× session inflation, the stock's own volume ratio was roughly 1.29× — no volume confirmation for the move.
- No catalyst could be identified for the +8.73% session, and biotech peers fell the same day (IBB −1.21%, XBI −0.97%), so it was not a sector move.
- After −9.83% and −7.67% on September 8–9 ($8.24 to $6.86), the stock is still below its September 4 close and −11.3% under the 52-week high.
- ATR is 6.7% of price and the 2×ATR reference is 13.4% away; at roughly $320M market capitalisation and about $7.3M of daily turnover, sizing and slippage are real constraints.
Scenarios
| Scenario | Probability | Path | Trigger / Invalidation |
|---|---|---|---|
| Alignment completes, swing high retested | 40% | SMA5 ($7.31) turns up through SMA20 ($7.63), the MACD histogram closes the −0.085 gap, and price works toward the August 4 swing high at $8.30 and then the 52-week high at $8.85. | Trigger: daily close above $8.30 on volume clearly above the 948,020 average once the session is not calendar-inflated. Invalidation: close back below SMA5 $7.31. |
| Sideways digestion | 35% | The one-session advance is absorbed and price oscillates around the SMA20 / Bollinger mid-band at $7.63, between the 38.2% retracement at $7.03 and the $8.30 swing high, while the averages knit back together. | Trigger: closes contained between $7.03 and $8.30 with ADX easing off 30.2. Invalidation: a decisive close outside either edge of that range. |
| Retracement resumes | 25% | The unconfirmed reclaim fades, price loses SMA20 and SMA5 and works back toward the 50% retracement and the lower Bollinger band, which coincide at $6.63, and then SMA60 at $6.36. | Trigger: close below the 38.2% retracement at $7.03. Invalidation: reclaim and hold of $7.63. |
Key Levels nearest to the close first, listed high to low
| Price | Role | Basis | Distance |
|---|---|---|---|
| $8.85 | Resistance | 52-week high | +12.7% |
| $8.30 | Resistance | August 4, 2026 swing high · 0% of the Fibonacci up-swing | +5.7% |
| $7.85 | Current | Close of September 18, 2026 | — |
| $7.63 | Support | SMA20 / Bollinger mid-band | −2.7% |
| $7.51 | Support | 23.6% retracement of the $4.97 → $8.30 up-swing | −4.3% |
| $7.31 | Support | SMA5 — the average the close must stay above for the stack to repair | −6.8% |
| $6.80 | 2×ATR stop | Objective invalidation reference, 2 × ATR $0.53 | −13.4% |
One unfilled gap sits far below, between $3.39 and $4.91 and dated July 13, 2026. It is a support gap in the JSON, but at roughly 40% below the close it is context for the two-year picture rather than a level that matters to the next few weeks.
What to Watch
- SMA5 crossing back above SMA20. At $7.31 against $7.63 this is the missing piece of the moving-average stack — without it, the "reclaim" is one close above one line.
- The MACD histogram at −0.085. Watch whether it narrows toward a cross back above the 0.166 signal line, or widens again; the August 10 dead cross is still the governing signal.
- Volume on any push toward $8.30. The reference is the 20-day average of 948,020 shares, on a session that is not calendar-inflated. The lesson of September 18 is that a raw ratio can be market-wide rather than stock-specific.
- Whether any company disclosure explains the +8.73% session. As of this writing no catalyst has been identified, and an unexplained advance is a thinner foundation than a confirmed one. That the cause is unknown is itself the finding.
- The $7.51–$7.63 cluster. The 23.6% retracement and the SMA20 / mid-band sit within twelve cents of each other; a clean loss of that shelf opens the 38.2% level at $7.03.
Conclusion
Past Analyses of This Stock same ticker · newest first
Other signals from this issue same publication date · 5 stocks
This analysis is an educational interpretation of chart data and is not investment advice. Probabilities and levels are subjective estimates; every investment decision, and its outcome, is your own responsibility. All figures are derived from closing-price data through September 18, 2026 and are not updated after publication.
Two Week Swing · twoweekswing.com · 4,600+ stocks screened weekly