Summit Therapeutics Inc.
$17.85 −38.9% from the 52-week high of $29.23 · +47.9% from the 52-week low of $12.07
This analysis is based on closing-price data as of September 18, 2026. Whether you're researching how to buy Summit Therapeutics Inc. stock or you've just opened a brokerage account and are trying to time an entry, here are objective support levels and stop-loss references built from the RSI, MACD and ATR indicators.
Two years of data show a stock that gave back most of a large advance — the close of $17.85 is −38.9% below the 52-week high of $29.23 — and then built a new base through August, with the 52-week low of $12.07 sitting just beneath the August 20 swing-low anchor of $12.43. What has changed over the past three weeks is the shape of the shorter-term structure: the full Close > SMA5 > SMA20 > SMA60 alignment turned true on September 9 and has now held eight consecutive sessions, the close has been above SMA20 and SMA60 since September 1, and MACD golden-crossed back on August 26. The important qualifier is where that structure sits — Mansfield RS is still −5.17% against the Nasdaq Composite, and this is a trend rebuilding well below prior highs rather than a breakout near them. The stock has not taken out its 20-day high.
Snapshot all figures from the chart JSON · as of September 18, 2026
| Close | $17.85 |
|---|---|
| 52-week high / low | $29.23 (−38.9%) / $12.07 (+47.9%) |
| SMA5 / SMA20 / SMA60 | $17.74 / $15.84 / $14.72 — close above all three; full alignment intact |
| Bollinger (20) | Upper $19.79 · Mid $15.84 · Lower $11.88 · width 49.99% |
| aVWAP — 90d | $14.92 (anchor Jul 24, 2026) — price above |
| aVWAP — 2y | $18.75 (anchor Apr 25, 2025) — price below |
| RSI (14) | 64.1 — no RSI divergence flagged |
| Mansfield RS | −5.17% vs the Nasdaq Composite · underperform · rising · prior week −6.501 · prior month −35.928 |
| MACD (12,26,9) | MACD 1.044 · Signal 0.873 · Histogram +0.171 · golden cross Aug 26, 2026 |
| ADX (14) | 27.8 — strong trend (direction-neutral) |
| ATR (14) | $0.93 — 5.2% of price |
| OBV — 2y / 90d | Accumulation, above MA20, rising in both frames · spread vs own MA20: 221.57% (2y) / 437.33% (90d) · no OBV divergence flagged |
| Volume | 13,059,500 shares — 1.97× the 20-day average of 6,636,150 · market-wide inflated session (see ② Volume) |
| Stop references | 1×ATR $16.92 (−5.2%) · 2×ATR $15.98 (−10.5%) |
① Price & Moving Averages
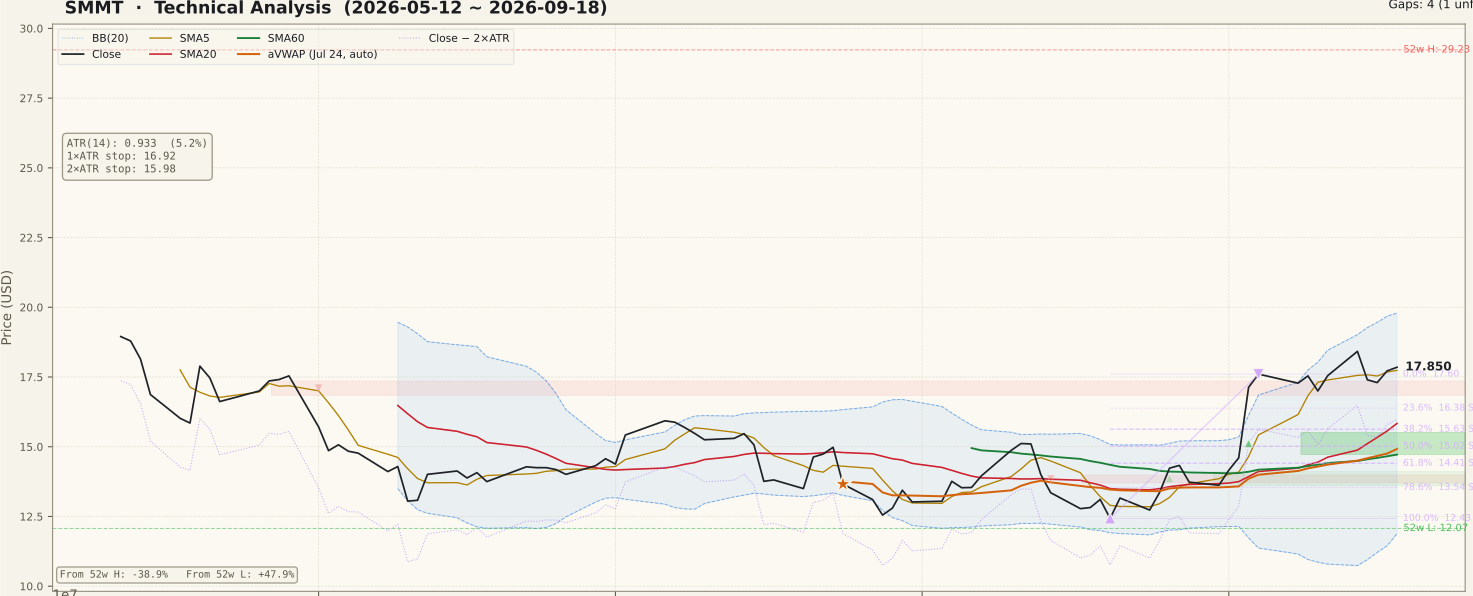
The moving-average stack is complete and, importantly, it is not a same-day artefact. Close $17.85 > SMA5 $17.74 > SMA20 $15.84 > SMA60 $14.72, and the SMA5 > SMA20 > SMA60 ordering first turned true on September 9 — eight consecutive sessions before the base date. The close moved above both SMA20 and SMA60 earlier still, on September 1, so thirteen sessions of the price-versus-average condition sit behind this reading. That ordering is what put the stock into the trend-pullback bucket rather than a breakout bucket: the 20-day high has not been taken out, and the close is below the September 14 intraday peak.
Bollinger width of 49.99% records an already-expanded band structure, with mid-band $15.84 doubling as SMA20 and the upper band at $19.79 roughly 11% overhead. The 90-day Fibonacci is anchored on the up-swing from $12.43 (August 20) to $17.60 (September 4), and the close has moved past the 0% anchor — so within that short swing there is no retracement level above price; the nearest labelled support is the 23.6% retracement at $16.38, then the 38.2% at $15.63. On the two-year frame the swing runs from $15.51 (March 20) to $26.38 (April 21), and its 78.6% retracement at $17.84 is within a cent of the close — price is resting exactly on the deepest of those long-frame retracement shelves. Two anchored VWAPs tell opposite stories and must not be mixed: the 90-day aVWAP of $14.92 (anchor July 24) is well below price, while the two-year aVWAP of $18.75 (anchor April 25, 2025) is above it, so the average long-frame buyer remains underwater. Gaps reinforce the same map — one unfilled support gap at $14.72–$15.52 dated September 3 sits below, and an unfilled resistance gap dated May 1 spans $16.81–$20.85, which means price is trading inside it and the unfilled portion overhead runs to $20.85.
② Volume

This is the panel most likely to be misread this week, so the context comes first. September 18, 2026 was quadruple witching and also the S&P quarterly rebalance trade date, with index changes effective before the open on Monday September 21. Both events force large mechanical prints across the whole market. The measured universe-wide median volume ratio on that session was 1.757× (398-ticker sample; independently 1.730× across all 4,395 scanned rows), against 0.70×–0.98× on each of the prior twelve sessions. Whatever a single stock's raw ratio reads, roughly three-quarters of extra turnover that day belongs to the calendar, not to the company.
SMMT closed the base date on 13,059,500 shares, 1.97× the 20-day average of 6,636,150 in the chart JSON (a separate five-session scan, measured against its own trailing baseline, put the same session at 2.07×). Adjusting either figure for the market-wide 1.757× leaves a stock-specific ratio of roughly 1.1×–1.2× — that is ordinary participation, essentially at the market median, and not a volume surge. SMMT was not part of the September index rebalance, so none of the inflation is index-flow into this name specifically. The honest conclusion is that the advance into the base date carries no volume confirmation; the preceding four sessions ran 1.08×, 0.90×, 0.98× and 0.98×, which is unremarkable turnover throughout. Liquidity itself is ample at roughly 6.6 million shares a day, so slippage is not the concern here — the concern is reading participation that did not happen.
③ MACD

MACD reads 1.044 against a signal line of 0.873, with the histogram positive at +0.171. The JSON dates the golden cross to August 26, 2026, sixteen sessions before the base date, which makes this the oldest of the three structural conditions on the page — momentum turned first, the price-versus-average condition followed on September 1, and the full moving-average ordering completed on September 9. That sequence is what a trend being rebuilt looks like, as opposed to several conditions snapping true on the same bar.
Two qualifications keep the reading balanced. The cross occurred well above the zero line, so it describes an extension of momentum already in progress rather than the early, higher-reward configuration of a cross from deep below zero. And the histogram at +0.171 is thin relative to a MACD of 1.044 — the two lines have converged since the September 9 area even as price held up, which is the mechanical signature of an advance losing slope. A histogram that keeps compressing toward zero while price stalls would be the first warning that the August 26 cross is being worked off.
④ RSI

RSI(14) reads 64.1 — comfortably above the 50 midline and still below the 70 overbought threshold. The two-year frame agrees at 64.0, so there is no timeframe conflict to resolve. On the panel the oscillator climbed out of the August trough and has been oscillating in the upper half of its range through September without pushing into overbought territory, which is the profile of a measured advance rather than a blow-off.
Both the divergence field and the two peak fields are null in the schema-1.2 sidecar, so no RSI divergence is claimed here and no peak-to-peak comparison is constructed. The practical level is 50: an RSI that holds above it through any consolidation keeps the trend reading defensible, while a decisive break below 50 would put the oscillator at odds with the moving-average stack and remove one of the cleaner supports for the constructive case. Note also that RSI at 64 leaves headroom in both directions — it is neither a stretched reading that invites mean reversion nor a fresh recovery off oversold.
⑤ Mansfield Relative Strength

Mansfield RS is −5.17% versus the Nasdaq Composite, state "underperform", slope "rising". The zero line matters more than the direction of travel here: despite everything constructive in the price structure, this stock has still lagged its benchmark over the measurement window. The anchor-free construction means the two-year and 90-day panels read identically, and they do. A negative RS reading is the standard warning flag the spec asks to be stated plainly even when other signals are bullish.
The quadrant arithmetic is where the encouraging part lives. Against the prior week's −6.501 the weekly change is +1.34 points; against the prior month's −35.928 the monthly change is +30.76 points. Both sit in negative territory with a positive change, which is improving — moving toward zero — and not "slowing", a word that only applies above the line. The monthly figure in particular quantifies how deep the hole was a month ago: the stock has closed roughly thirty-one points of relative gap in four weeks without yet crossing into outperformance. Zero is the level that matters, and it is still above the current reading.
⑥ ATR & ADX

ATR(14) is $0.93, or 5.2% of the closing price — a moderate volatility unit by biotechnology standards, and materially tighter than the double-digit ATR percentages that some names in this sector carry. It drives the risk side of the page directly: the 1×ATR reference sits at $16.92, 5.2% below the close, and the objective 2×ATR invalidation lands at $15.98, $1.87 or 10.5% below. That stop is structurally well-placed, falling just above SMA20 $15.84 and between the 23.6% ($16.38) and 38.2% ($15.63) retracements — a stop tighter than roughly one ATR would be taken out by ordinary daily range rather than by a change in the chart.
ADX(14) at 27.8 is above the 25 threshold and tagged "strong" (the two-year frame reads 27.3, so the two agree). The standard caution applies: ADX measures trend strength, not direction. Here it corroborates that the September advance has genuine trend character rather than being range noise, but it would read equally high on a decline of the same persistence. Read together with the moving-average stack — which does supply direction — the pair supports a directional trend reading; read alone, ADX says nothing about which way the next leg runs.
⑦ OBV

Both timeframes tag OBV as accumulation, above its MA20 and rising — the two frames agree, which is not always the case and is worth stating. The 90-day OBV of 20,335,600 sits 437.33% above its own MA20 of −6,028,485; the two-year series reads 14,465,200 against an MA20 of −11,898,885, a 221.57% spread. Both percentages should be read with care: this field is the OBV-versus-MA20 gap, a measure of accumulation intensity, and it is not a divergence reading. Both MA20 values here are negative, which mechanically inflates the percentage — the direction of the gap is meaningful, the magnitude is close to meaningless.
The divergence fields themselves are null in both frames, so no OBV divergence is claimed and no peaks are cited. What the panel does show is a volume series that turned up through the August base and has stayed above its moving average since, meaning the advance was not built purely on price drift with volume leaking away. That is a genuine positive — but it sits against ② above, where the base-date session offered no stock-specific confirmation once the witching and rebalance inflation is removed. Accumulation over weeks and confirmation on a single day are different claims, and only the first is supported here.
Bull Case vs Bear Case
Bull Case
- Full alignment intact: Close $17.85 > SMA5 $17.74 > SMA20 $15.84 > SMA60 $14.72, first true September 9 and held eight consecutive sessions.
- The close has been above both SMA20 and SMA60 since September 1 — the trend predates the base date rather than forming on it.
- MACD golden-crossed August 26 and remains positive: 1.044 over signal 0.873 with a +0.171 histogram.
- Relative strength is improving fast — −5.17% now against −35.928 a month ago, a +30.76 point closing of the gap, and +1.34 points week over week.
- OBV is in accumulation, above MA20 and rising in both timeframes; the August base was built on genuine volume participation.
- Price holds well above the 90-day anchored VWAP $14.92 (July 24 anchor) and above the unfilled September 3 support gap at $14.72–$15.52; ADX 27.8 confirms trend character.
Bear Case
- Mansfield RS is still below zero at −5.17% versus the Nasdaq Composite — improving, but state "underperform".
- The close is −38.9% under the 52-week high of $29.23: this is a structure rebuilding far below prior highs, not a breakout near them.
- The two-year anchored VWAP of $18.75 sits above price, so the average long-frame buyer is still underwater and that line is overhead supply.
- An unfilled May 1 resistance gap spans $16.81–$20.85 and price trades inside it — unfilled overhead runs all the way to $20.85.
- No volume confirmation: after removing the market-wide 1.757× witching and rebalance inflation, the base-date session adjusts to roughly 1.1×–1.2× — ordinary participation.
- The 20-day high has not been broken, RSI at 64.1 leaves limited room before overbought, and the 2×ATR stop is $1.87 (−10.5%) away.
Scenarios
| Scenario | Probability | Path | Trigger / Invalidation |
|---|---|---|---|
| Continuation into the gap | 40% | The eight-session alignment extends: price clears the September 14 area, works toward the two-year anchored VWAP at $18.75 and then into the unfilled May 1 gap, with the Bollinger upper band at $19.79 as the next mechanical ceiling. | Trigger: close above $18.75 on volume above the 20-day average of 6,636,150 shares in a normal session. Invalidation: close back below SMA5 $17.74 and the $17.60 swing-high shelf. |
| Shelf consolidation | 35% | Price digests the September advance between the $16.38–$17.60 support band and the $18.75 anchored VWAP while the MACD histogram works off its compression and relative strength continues grinding toward zero. | Trigger: repeated closes trapped between $17.60 and $18.75 with RSI holding 50–70. Invalidation: a decisive close outside either edge of that band. |
| Retracement to the stack | 25% | The $16.38 retracement fails and price returns to the SMA20 / Bollinger mid-band cluster at $15.84, taking out the objective stop reference on the way and putting the September 9 alignment back in question. | Trigger: close below $16.38 with RSI losing 50. Invalidation: a fast reclaim of $17.60 and SMA5. |
Probabilities are subjective estimates derived from the chart structure described above, not statistical forecasts.
Key Levels
| Price | Role | Basis |
|---|---|---|
| $19.79 | Resistance | Bollinger upper band (20, 2σ) |
| $18.75 | Resistance | 2-year anchored VWAP (anchor April 25, 2025) — price below it |
| $17.85 | Current close | Close of September 18, 2026 · also the 78.6% retracement of the two-year $15.51 → $26.38 swing ($17.84) |
| $17.74 | Support | SMA5 — the top rung of the moving-average stack |
| $17.60 | Support | September 4 swing high · 0% anchor of the 90-day Fibonacci swing, now beneath price |
| $16.38 | Support | 23.6% retracement of the $12.43 → $17.60 up-swing |
| $15.98 | 2×ATR stop | Objective invalidation, −10.5% from the close (ATR $0.93) · sits just above SMA20 $15.84 |
What to Watch
- The $17.60–$17.74 shelf. SMA5 and the September 4 swing high sit within fourteen cents of each other directly under price; holding above them keeps the eight-session alignment intact, while losing them breaks the top rung of the stack first.
- The two-year anchored VWAP at $18.75. It is the nearest meaningful overhead line and the level at which the average long-frame buyer stops being underwater — reclaiming it would change the supply picture above price.
- Volume in a normal session. September 18 was distorted market-wide by quadruple witching and the S&P rebalance. The first clean reading above 6,636,150 shares on an ordinary day is the confirmation this advance currently lacks.
- The Mansfield RS zero line. RS has closed 30.76 points of relative gap in a month but still reads −5.17%. A crossing of zero would be the first session in which this stock is genuinely leading its benchmark rather than catching up to it.
- The unfilled September 3 gap at $14.72–$15.52. It sits below the 2×ATR stop and below SMA20; a move into it would mean the whole September structure has been unwound.
Conclusion
Past Analyses of This Stock same ticker · newest first
Other signals from this issue same publication date · 5 stocks
This analysis is an educational interpretation of chart data and is not investment advice. Probabilities and levels are subjective estimates; every investment decision, and its outcome, is your own responsibility. All figures are derived from closing-price data through September 18, 2026 and are not updated after publication.
Two Week Swing · twoweekswing.com · 4,600+ stocks screened weekly