EuroDry Ltd.
$68.78 −5.87% from the 52-week high of $73.07
This analysis is based on closing-price data as of September 18, 2026. Whether you're researching how to buy EuroDry Ltd. stock or you've just opened a brokerage account and are trying to time an entry, here are objective support levels and stop-loss references built from the RSI, MACD and ATR indicators.
EDRY sits at the mature end of one of the most extended advances in the current screen. The moving-average stack has been aligned — close above SMA5 above SMA20 above SMA60 — continuously since July 16, a run of 46 consecutive sessions, and the stock closed Friday at $68.78, just −5.87% below its 52-week high of $73.07. Mansfield RS of +196.09% against the Nasdaq Composite puts it in the top tier of relative performance. The counterweight is that every reading that made this structure attractive is now stretched: RSI at 71.99 carries a flagged bearish divergence, ADX at 74.21 is an extreme rather than an emerging trend reading, and Friday's −4.27% decline arrived on the thinnest relative volume of the week. The useful question for a 46-session trend is not whether it exists, but whether it is still being confirmed.
Snapshot all figures as of September 18, 2026 close
| Metric | Value | Reading |
|---|---|---|
| Close | $68.78 | Base date Fri, Sep 18 |
| 52-week High / Low | $73.07 / $10.69 | −5.87% from high · +543.10% from low |
| Moving Averages | SMA5 $68.44 · SMA20 $57.90 · SMA60 $37.65 | Aligned since Jul 16 — 46 sessions |
| Bollinger Bands | Upper $74.17 · Mid $57.90 · Lower $41.63 | Width 56.21% — heavily expanded |
| Anchored VWAP (90d) | $42.56 | Anchor Jun 15, 2026 · price far above |
| Anchored VWAP (2y) | $36.29 | Anchor Sep 18, 2025 · price far above |
| RSI (14) | 71.99 | Overbought zone · bearish divergence flagged |
| Mansfield RS vs Nasdaq Composite | +196.09% | Outperform, rising · wk −9.49 · mo +70.96 |
| MACD | 8.36 / signal 7.74 / hist +0.61 | Golden cross intact since July |
| ADX | 74.21 | Strong — an extreme reading |
| ATR (14) | $4.85 | 7.05% of price |
| OBV (90d / 2y) | 3,307,100 / 3,376,300 | Accumulation, above MA20, rising · spread +18.19% / +17.75% |
| Volume | 137,400 vs 20-day avg 181,360 | 0.758× raw · roughly 0.43× adjusted for a heavy tape |
| 1× / 2× ATR stop | $63.93 / $59.08 | 2× ATR sits −14.11% below the close |
① Price & Moving Averages
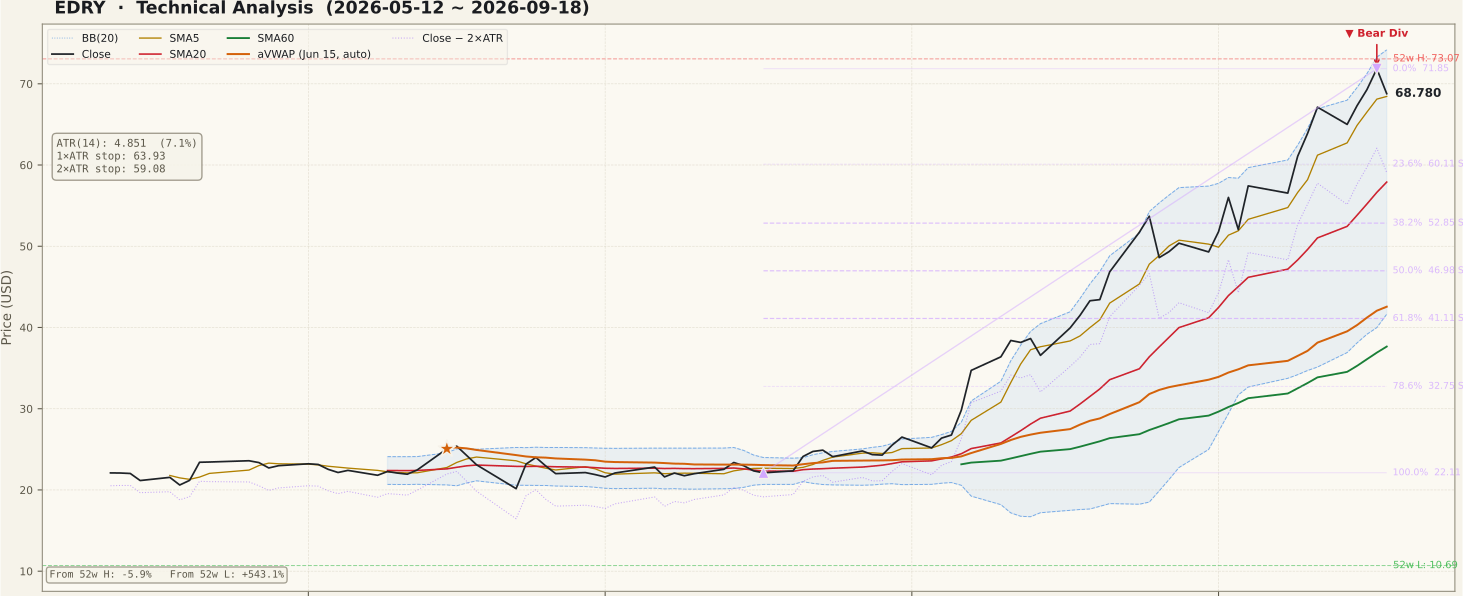
The stack is textbook bullish and it is old. Close $68.78 sits above SMA5 $68.44, which sits above SMA20 $57.90, which sits above SMA60 $37.65 — and that ordering has held without interruption since July 16, 46 consecutive sessions. The close first moved above both SMA20 and SMA60 on July 20, 44 sessions back. The spacing is what stands out: SMA20 is roughly eleven dollars beneath the close and SMA60 is more than thirty below, so the nearest moving-average support of any consequence is the fast line itself.
Bollinger structure frames the same stretch. The upper band at $74.17 is
just above the 52-week high of $73.07, the mid band coincides with SMA20 at
$57.90, and bb_width_pct of 56.21%
describes bands that have already expanded a long way — band width at this level is generally a
late-stage characteristic rather than the beginning of one. Both anchored VWAPs sit far below price
(90-day $42.56 from the June 15 anchor; two-year $36.29
from the September 18, 2025 anchor), meaning buyers from either anchor forward are above water and
overhead supply from those cohorts is thin.
The Fibonacci grid is drawn on an up-swing from the July 17 low of $22.11 to the September 17 high of $71.85, so its levels read as pullback support. The first shelf is the 23.6% retracement at $60.11; below that the 38.2% sits at $52.85 and the 50% at $46.98. Note how far apart those are — a 23.6% give-back is already an $8.67 move from Friday's close. There are no unfilled gaps overhead anywhere in the two-year record; the three that remain open ($14.50/$14.19 from February 18, $11.15/$10.62 from August 28, 2025 and $9.01/$8.40 from June 10, 2025) all sit far below and have no practical bearing on current structure.
② Volume

This is the most informative panel on the page, and it needs its context stated. Friday's volume was
137,400 shares against a 20-day average of 181,360,
a vol_avg_ratio of 0.758×. September 18 was quadruple witching
and also the trade date for the S&P quarterly rebalance, with the index changes taking effect
before the open on September 21. That lifted turnover across the whole tape: the universe-wide median
volume ratio measured 1.757× on September 18 (398-ticker sample;
1.730× across all 4,395 scanned rows) against 0.70×
to 0.98× on each of the twelve prior sessions. EDRY was not part of the
September index rebalance.
Set the stock's 0.758× against a market trading at 1.757× and the adjusted reading is roughly 0.43× — participation well under half the market's, on a day when nearly everything else traded heavy. The raw number alone understates how quiet this was. Friday's −4.27% decline therefore came on unusually thin interest relative to the tape, which cuts both ways: a drop on light volume is not a distribution event, but a stock this far into an advance would ordinarily be expected to attract volume on a witching day rather than shed it.
The five sessions into the base date read −3.16% (2.50× volume), +3.54% (1.20×), +2.94% (1.41%), +3.71% (1.27×) and −4.27% (0.76×): one heavy decline, three consecutive advances into the September 17 high, then a give-back on the week's lightest relative volume. No session reached the 8% review threshold and no catalyst event was identified in the window. The shape worth holding on to is that the advance was made on ordinary participation and the pullback on less than that — the tape has not yet said which side is committed.
③ MACD

MACD stands at 8.36 above a signal line of 7.74, with a histogram of +0.61. The last cross was golden and it has been in place since July — the 90-day sidecar dates it July 14 and the two-year sidecar dates it July 21, a one-week spread that comes from the different seed windows the two lookbacks use for their exponential averages. The measured date on which MACD first closed above its signal and stayed there is July 21, 43 sessions before the base date. Either way the cross is old, not fresh.
The level matters more than the cross here. An MACD line above 8 on a $68.78 stock reflects how far the fast average has pulled away from the slow one, which is a measure of how quickly this move happened rather than of how much further it can go. Against that, a histogram of +0.61 is a thin margin — roughly seven percent of the MACD line's own value. The two lines are still separating in the bullish direction, but by a narrowing amount.
For a trend this mature, the honest read is that MACD is confirming continuation rather than signalling it. A histogram that crosses below zero would mark the first momentum deceleration of the advance; until it does, this panel is neutral-to-supportive and should not be leaned on as independent evidence of a fresh upswing.
④ RSI

RSI reads 71.98, above the conventional 70 line, and the sidecar flags a regular bearish divergence with both peaks specified. The first peak is July 31 at price $26.51 with RSI 80.70; the second is September 17 at price $71.85 with RSI 78.95. Price made a dramatically higher high while RSI made a lower one — the textbook pattern.
It deserves a careful reading rather than an alarmed one. The RSI shortfall between the two peaks is 1.75 points while price between them nearly tripled, so the momentum deterioration this divergence describes is real but slight. A common beginner error is to treat a flagged divergence as a called top; divergences describe a loss of momentum confirmation, not a reversal, and strongly trending stocks can carry one for many weeks. The second peak is also only one session before the base date, which means it has had no time to be either confirmed or cancelled.
The practical test is mechanical: if price clears $71.85 and RSI prints a reading above 78.95 alongside it, the divergence is cancelled outright. If price clears that high while RSI again falls short, the pattern extends and the non-confirmation becomes harder to dismiss. Meanwhile an RSI of 71.98 on a 46-session trend is simply an extended reading — it constrains how much room is left in the near term without saying anything about direction.
⑤ Mansfield Relative Strength

Mansfield RS measures +196.09% versus the Nasdaq Composite, the benchmark for Nasdaq-listed names, with a state of outperform and a rising slope. This is the reading that put EDRY into this week's screen as a relative-strength candidate; the line sits far above the zero baseline on both the 90-day and two-year panels, which is expected since Mansfield RS is anchor-free and the two timeframes must agree.
The two comparison points move in different directions, and both belong in the picture. The week-ago value was 205.587, so the weekly change is −9.49 points: still deep in positive territory, but slowing. The month-ago value was 125.131, so the monthly change is +70.96 points — strongly accelerating over the longer window. In plain terms, EDRY's outperformance over the past month has been enormous and over the past week has begun to give a little back.
That combination is what a relative-strength leader looks like as it matures. The slowing is not deterioration — deterioration would require the line to move toward zero from below, and this line is nowhere near zero. But a weekly reading that turns down after a month of acceleration is the first place a leadership change tends to appear, which makes the next few weekly prints the more informative half of this panel.
⑥ ATR & ADX

ATR is $4.85, which is 7.05% of the closing price. That is a wide daily range in absolute terms and it drives everything on the risk side of this page: the 1× ATR reference sits at $63.93 and the 2× ATR reference at $59.08, the latter −14.11% below Friday's close. A stop placed at a structurally sensible distance is therefore a long way away, and position size has to be set against that distance rather than against a comfortable percentage.
ADX reads 74.21, classified as strong. Readings above 25 denote a trending regime and readings in the seventies are rare — this is among the highest ADX values in the current screen. ADX measures trend strength and not direction, so a high value confirms that the advance has been orderly and persistent; it says nothing about whether the next move is up.
The nuance worth internalising is that extreme ADX readings tend to resolve by falling, because a value this high implies a rate of directional travel that is difficult to sustain. A cooling ADX alongside a holding price is a consolidation; a cooling ADX alongside a falling price is the trend losing its structure. The panel does not yet distinguish between those two, and it is the pairing with price rather than the ADX number itself that carries the information.
⑦ On-Balance Volume

Both timeframes agree, which is worth stating explicitly because they often do not. On the 90-day panel OBV is 3,307,100 against an MA20 of 2,798,055, tagged accumulation, above its average and rising, with a spread of +18.19%. On the two-year panel OBV is 3,376,300 against an MA20 of 2,867,255, also accumulation, also above and rising, spread +17.75%. Volume has been flowing to the up side on both horizons.
One clarification about that spread figure: divergence_pct is the gap between OBV and its
own 20-period average — a measure of accumulation intensity — not a divergence reading. The actual
divergence field is obv.divergence, and here it is null on both timeframes with both
peak fields null as well. There is no OBV divergence to report, in either direction.
That leaves a split between the two volume-based panels that should be held in view rather than smoothed over. OBV, which accumulates over twenty sessions and more, says money has been moving in. The raw volume panel, looking at the single most recent session, says participation was unusually light. Both are true; they describe different windows. The OBV reading is the more established of the two and the volume reading is the more current, and it is the current one that has not yet been confirmed.
Bull vs Bear
Bull Case
- Close $68.78 above SMA5 $68.44 above SMA20 $57.90 above SMA60 $37.65 — aligned continuously since July 16, 46 sessions.
- Mansfield RS +196.09% versus the Nasdaq Composite, state outperform with a rising slope, and +70.96 points above the month-ago level of 125.131.
- MACD 8.36 above signal 7.74 with a positive histogram of +0.61; the golden cross has been intact since July.
- OBV in accumulation, above its MA20 and rising on both the 90-day and two-year panels — spreads of +18.19% and +17.75%.
- Price sits far above both anchored VWAPs (90-day $42.56, two-year $36.29), so buyers from both anchors forward are in profit and overhead supply is thin.
- ADX 74.21 confirms a strongly trending regime, and no unfilled gap sits overhead anywhere in the two-year record.
Bear Case
- RSI 71.98 is above 70 with a flagged bearish divergence: July 31 peak RSI 80.70 at $26.51 versus September 17 peak RSI 78.95 at $71.85.
- Friday's −4.27% decline came on 0.758× average volume — roughly 0.43× once measured against a market trading at 1.757×. Participation is not confirming the move.
- Mansfield RS weekly change of −9.49 points (196.09 versus 205.587) — positive but slowing for the first time after a month of acceleration.
- Price is only −5.87% below the 52-week high of $73.07, with the upper Bollinger band at $74.17 immediately above — limited headroom before the envelope.
bb_width_pctof 56.21% describes bands already far expanded, a characteristic of a late-stage move rather than an early one.- ATR at 7.05% of price puts the 2× ATR reference −14.11% below the close, so any structurally placed invalidation level is a wide one to carry.
Scenarios
| Scenario | Probability | Path | Trigger / Invalidation |
|---|---|---|---|
| Trend extends to a new high | 40% | Holds above SMA5 $68.44, reclaims the September 17 high $71.85, then works through the 52-week high $73.07 toward the upper band $74.17. A concurrent RSI print above 78.95 would cancel the divergence. | Trigger: daily close above $71.85 on volume above the 20-day average of 181,360. Invalidation: close below $60.11. |
| Sideways digestion above the 23.6% shelf | 40% | Price oscillates between the 23.6% retracement at $60.11 and the September 17 high $71.85 while RSI unwinds from 71.98 and ADX cools from 74.21. Bollinger width contracts from 56.21% and SMA20 $57.90 rises toward price. | Trigger: failure to clear $71.85 while $60.11 holds on a closing basis. Invalidation: a decisive close outside either boundary. |
| Deeper retracement into the moving-average gap | 20% | Loss of $60.11 opens the empty stretch between there and SMA20 $57.90, then the 38.2% retracement at $52.85. The 2× ATR reference at $59.08 sits inside this zone. | Trigger: close below $60.11 on expanding volume. Invalidation: reclaim of SMA5 $68.44. |
Key Levels
| Price | Role | Basis |
|---|---|---|
| $74.17 | Resistance | Upper Bollinger band |
| $73.07 | Resistance | 52-week high |
| $71.85 | Resistance | September 17 swing high · 0% of the Fibonacci swing |
| $68.78 | Current | Close of Fri, Sep 18 |
| $68.44 | Support | SMA5 — the nearest moving average |
| $60.11 | Support | 23.6% retracement of the Jul 17 – Sep 17 swing |
| $59.08 | 2× ATR stop | Objective invalidation · −14.11% from the close |
What to Watch
- Whether volume re-engages. Friday's 137,400 shares against a 20-day average of 181,360 — roughly 0.43× the market's own pace on a witching day — is the single least confirmed element of this setup. Advances on below-average participation are the classic unconfirmed breakout trap.
- The September 17 high at $71.85, and what RSI does alongside it. A price high accompanied by an RSI print above 78.95 cancels the flagged divergence; a price high with RSI again short of it extends the non-confirmation.
- The $60.11 shelf. With SMA20 down at $57.90, the 23.6% retracement is the first structural line beneath price and the boundary that separates digestion from something deeper.
- Mansfield RS weekly prints. The −9.49-point weekly change is the first slowing after a +70.96-point month. A second and third consecutive weekly decline would matter far more than this one.
- ADX cooling paired with price. A fall from 74.21 while price holds above SMA5 $68.44 reads as consolidation; the same fall with price giving way reads as the trend losing structure.
Conclusion
Past Analyses of This Stock same ticker · newest first
Other signals from this issue same publication date · 5 stocks
This analysis is an educational interpretation of chart data and is not investment advice. Probabilities and levels are subjective estimates; every investment decision, and its outcome, is your own responsibility. All figures are derived from closing-price data as of September 18, 2026 and do not account for events after that close.
Two Week Swing · twoweekswing.com · 4,600+ stocks screened weekly