Marathon Petroleum Corporation
$424.89 −0.73% from the 52-week high of $428.00
This analysis is based on closing-price data as of September 18, 2026. Whether you're researching how to buy Marathon Petroleum Corporation stock or you've just opened a brokerage account and are trying to time an entry, here are objective support levels and stop-loss references built from the RSI, MACD and ATR indicators.
MPC closed the week at $424.89, within 0.73% of its 52-week high and 162.4% above the 52-week low of $161.93 — the top of a very large two-year advance rather than an early-stage move. The structure behind that position has been building for weeks: the close has held above both SMA20 and SMA60 since August 10 (29 sessions), the moving averages have been in bullish order since August 12 (27 sessions), and the 20-day-high breakout that put this stock on the screen first registered on September 15, four sessions before the base date. The tension worth reading carefully is on the other side: RSI is 83.07, price is a fraction below the upper Bollinger band, and the final session printed volume at 3.479× the 20-day average while the price itself moved only +0.69% — a combination that needs unpacking rather than cheering.
Snapshot all figures as of the September 18, 2026 close
| Metric | Value | Read |
|---|---|---|
| Close | $424.89 | New swing high; fibonacci anchor high dated Sep 18, 2026 |
| 52-week high / low | $428.00 / $161.93 | −0.73% from high · +162.4% from low |
| SMA 5 / 20 / 60 | $413.61 / $387.32 / $333.43 | Bullish order: close > 5 > 20 > 60, held 27 sessions |
| Bollinger upper / mid / lower | $429.47 / $387.32 / $345.17 | Close is 1.08% under the upper band; width 21.77% |
| aVWAP — 90d (anchor Aug 10, 2026) | $378.11 | Price 12.4% above the short-term anchored VWAP |
| aVWAP — 2y (anchor Nov 4, 2025) | $248.77 | Long-term buyers are deep in profit |
| RSI(14) | 83.07 | Deep in the overbought zone (>70) |
| Mansfield RS vs the S&P 500 | +66.12% | Outperform, rising (prev week 57.16 · prev month 48.40) |
| MACD / signal / histogram | 21.186 / 19.683 / +1.503 | Golden cross Sep 15, 2026; histogram positive |
| ADX(14) | 49.90 | Strong trend — roughly double the 25 threshold |
| ATR(14) | $12.72 (2.99% of price) | Daily range budget for position sizing |
| OBV — 2y / 90d | Accumulation, above MA20, rising / Accumulation, above MA20, rising | Both timeframes agree — unusual and worth noting |
| Volume (last / 20-day avg) | 9,855,700 / 2,832,770 | 3.479× average — but see ② for the quadruple-witching adjustment |
| 1× / 2× ATR stop | $412.17 / $399.45 | 2× ATR sits 5.99% below the close |
① Price & Moving Averages
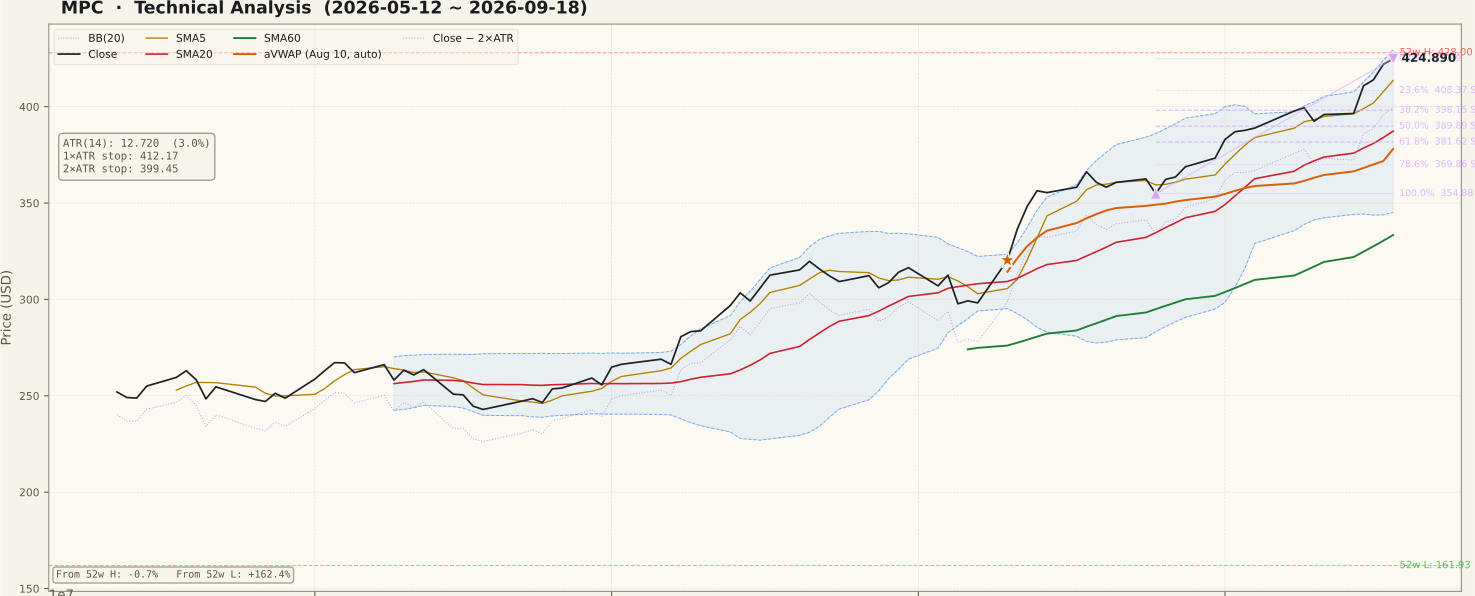
The averages are stacked in textbook bullish order — close $424.89 > SMA5 $413.61 > SMA20 $387.32 > SMA60 $333.43 — and the dating matters more than the arrangement. That alignment first held on August 12, 2026 and has been intact for 27 consecutive sessions; the close first reclaimed both SMA20 and SMA60 on August 10, 29 sessions ago. The 20-day-high breakout, which is the reason this name surfaced in the weekly screen, first turned true on September 15 — four sessions before the base date, not on the base date itself. Those three dates rule out the most common failure mode in a breakout screen: a setup that exists only because of one dramatic final bar.
On the 90-day panel the shape is a steady stair-step advance from the mid-$300s in late August, with the August 25 swing low at $354.88 as the last meaningful pivot. The 2-year panel puts that in scale: price is 162.4% above the $161.93 52-week low, so this is the upper reach of a very large move. The spacing between the averages is the honest caution here — SMA60 sits $91.46 below the close, roughly seven ATRs, which is what a trend looks like after it has run a long way rather than at the start. Bollinger width at 21.77% confirms the expansion is already well underway; this is not a coiled, pre-breakout reading. The two unfilled gaps in the 2-year record ($165.36–$171.50 from January 5, 2026 and $152.32–$156.21 from May 12, 2025) sit far below current price and are historical reference points, not active magnets.
② Volume

The base session traded 9,855,700 shares against a 20-day average of 2,832,770 — a ratio of 3.479×, and comfortably the tallest bar on the panel. Taken alone that reads as emphatic confirmation. It is not, and the reason is calendar rather than company. September 18, 2026 was quadruple witching and also the S&P quarterly rebalance trade date, with index changes effective before the open on Monday, September 21. Measured across the screening universe, the median volume ratio that day was 1.757× (398-ticker sample; 1.730× across all 4,395 scanned rows), against 0.70–0.98× on each of the twelve preceding sessions. Nearly the whole market printed a heavy bar.
Adjusting for that market-wide inflation, MPC's stock-specific participation was closer to 1.98× — still above average, still the heaviest relative session of the window, but roughly half of what the raw 3.479× suggests. The second correction is more important than the first: the price move on that 3.479× bar was only +0.69%. Enormous volume with a near-flat close is the signature of shares changing hands, not of shares being chased — index funds and expiring derivative positions crossing size at the print. MPC is an existing S&P 500 constituent and was not among the September additions or deletions, so none of this reflects a change in its own index membership; it is the ambient flow of the session. The five-session record is the better guide to real participation: +0.13%, +3.63%, +0.75%, +1.94%, +0.69%, on volume ratios of 1.51, 1.18, 1.18, 1.09 and 3.97× (that last figure on the scan's shorter baseline; the JSON's 3.479× is the canonical one). Steady above-average interest, no single panic bar, no session near the 8% review threshold, and no catalyst event identified anywhere in the window.
③ MACD

MACD reads 21.186 against a signal line of 19.683, giving a positive histogram of +1.503, and the last crossover was a golden cross on September 15, 2026 — the same session the 20-day-high breakout first registered. The two momentum events are therefore three trading days old, which makes them the youngest part of this setup while the moving-average structure is the oldest part.
The level deserves as much attention as the cross. Both lines sit far above zero — MACD at 21.186 on a $424.89 stock — which describes a trend well into its move rather than one turning up from a base. A crossover made this far above the zero line carries less runway than one made from deep negative territory, and it is also more prone to whipsaw: the two lines are separated by only 1.503 points, so a few flat sessions would close that gap. The histogram is the specific thing to follow. Continued expansion supports the advance; a histogram that shrinks while price holds near $424.89 would be the first quiet evidence of momentum draining beneath a flat tape.
④ RSI

RSI(14) is 83.07 — not merely overbought but an extended reading, well above the 70 line and in the zone where the indicator spends only a small fraction of its time. The 90-day panel shows it climbing progressively rather than spiking, which is consistent with the 27-session alignment: this is a reading built by a persistent trend, not by one violent bar.
The common beginner error is to read >70 as a reversal signal. In a genuine trend RSI can hold above 70 for
weeks, and an 83 reading next to an ADX of 49.90 is exactly the fingerprint of a strong trend rather than an
imminent top. The accurate framing is about cost, not direction: at 83.07 the stock has already made most of
a move that started far lower, so an entry here is paying full price for that trend and accepting a stop that
begins 5.99% away. The JSON reports no RSI divergence — the rsi.divergence field is
null with no peak pair recorded — so there is no evidence of price making highs that momentum refuses to
confirm. Absence of divergence supports the bull side; it is not a guarantee, and it can appear later if a
second high arrives on weaker momentum.
⑤ Mansfield Relative Strength

Mansfield RS vs the S&P 500 stands at +66.12%, firmly in outperform territory with a rising slope. Reading the change rather than the level: one week ago the value was 57.16 and one month ago 48.40, so RS has gained 8.96 points over the week and 17.72 points over the month. Positive and rising places this in the accelerating quadrant — the strongest of the four states, and the one that has held across the entire 90-day panel.
Two qualifications keep this honest. First, the gain is far more than an artifact of the final bar: MPC was already outperforming by 48.40 points a month ago, so relative strength predates the September breakout rather than arriving with it. Second, sector context cuts the other way for the base day specifically. Energy peers were roughly flat on September 18 — XLE closed −0.26% — so Friday was not a sector-wide push, and MPC's +0.69% came without the rest of the group behind it. That is a mildly favourable relative reading for the day itself, but far too small a move to build an argument on. The month-scale RS acceleration is the substantive signal here; the single session is not.
⑥ ATR & ADX

ATR(14) is $12.72, or 2.99% of price — a moderate volatility reading for a stock that has advanced this far, and notably it has not exploded on the breakout the way it often does. For sizing, a 1× ATR reference sits at $412.17 (just under SMA5 at $413.61) and the 2× ATR reference at $399.45, 5.99% below the close. That percentage is the real entry cost of this setup and it should be decided before, not after, any position exists.
ADX(14) is 49.90, labelled strong and sitting at roughly double the 25 threshold. This is the most emphatic number on the page and the natural counterweight to RSI 83.07: the trend-strength gauge is not merely confirming the move, it is reading at a level that appears in sustained directional runs. Two cautions apply. ADX measures strength, not direction — a high reading would equally describe a strong decline — so it confirms whatever price is doing rather than predicting it. And readings near 50 are historically closer to the ceiling of the indicator's range than the floor, which means the more common next development is a decline in ADX as the trend consolidates, not a further rise.
⑦ OBV

Both timeframes agree, which is less common than it sounds. On the 90-day window OBV is tagged accumulation, above its MA20 and rising, with OBV at 65,960,000 against an MA20 of 38,512,730 — a spread of 71.27%. On the 2-year window it is also accumulation, above MA20 and rising, with OBV at 148,877,800 against 121,430,530 — a spread of 22.60%. Short-term flow is running ahead of the long-term baseline, which is what a genuine advance out of a base should look like, and neither timeframe shows the "new high, lagging volume" pattern that flags an unconfirmed breakout.
Two clarifications. The 71.27% and 22.60% figures are the spread between OBV and its own 20-day average — a
measure of how far flow has stretched from its baseline — and are not divergence readings despite the
field name; they inflate whenever the moving average sits near zero. Divergence is judged separately, and the
JSON records no OBV divergence (obv.divergence is null, no peak pair). The second
point loops back to section ②: because OBV adds the full volume of an up day regardless of how small the price
move was, the 9.86-million-share witching session contributed its entire size to the OBV line on a +0.69% close.
The tag is sound, but part of the final leg's steepness is calendar flow rather than conviction.
Bull vs Bear
Bull Case
- Moving averages in full bullish order for 27 consecutive sessions — close $424.89 > SMA5 $413.61 > SMA20 $387.32 > SMA60 $333.43.
- The breakout is not a one-bar artifact: the 20-day-high condition first turned true on September 15, four sessions before the base date, and the close has held above SMA20 and SMA60 since August 10.
- ADX 49.90 — roughly double the 25 strong-trend threshold, the clearest trend-strength reading on the page.
- Mansfield RS +66.12% vs the S&P 500 and accelerating: +8.96 points on the week, +17.72 on the month, with outperformance predating the September breakout.
- OBV in accumulation on both the 2-year and 90-day windows, above MA20 and rising on each, with no bearish divergence recorded on OBV or RSI.
- Price is 12.4% above the 90-day anchored VWAP ($378.11) and far above the 2-year anchor ($248.77) — little trapped supply directly overhead.
Bear Case
- RSI 83.07 is an extended reading, not merely overbought — the indicator spends little time this high in any regime.
- Price sits 0.73% below the 52-week high of $428.00 and just 1.08% under the upper Bollinger band at $429.47 — two overhead references within roughly one ATR.
- The 3.479× volume bar is substantially a calendar effect: adjusted for the market-wide 1.757× witching and rebalance inflation, stock-specific participation was near 1.98×, and the price moved only +0.69% on it.
- SMA60 sits $91.46 below the close — around seven ATRs — so any full trend reset would be a long way down.
- ADX near 50 is closer to the historic ceiling of the indicator than the floor; the more frequent next move is a decline into consolidation.
- No catalyst was identified in the five-session window, and energy peers were roughly flat on the base date (XLE −0.26%), so the final session had no sector push behind it.
Scenarios
| Scenario | Probability | Path | Trigger / Invalidation |
|---|---|---|---|
| Breakout continuation | 40% | Price clears the 52-week high at $428.00 and the upper Bollinger band at $429.47, then walks the band higher while SMA5 rises to meet it; ADX holds near 50 and the MACD histogram expands beyond +1.503. | Trigger: a close above $429.47 on volume at or above average, measured on a post-witching session. Invalidation: a close back below the 23.6% retracement at $408.37. |
| Digest the extension | 35% | The 83.07 RSI reading unwinds sideways or with a shallow pullback into the $398.15–$408.37 retracement band while SMA20 climbs; ADX eases off 50 without the alignment breaking. | Trigger: two or three narrow-range sessions on fading volume with price holding above SMA5 $413.61. Invalidation: a close below the 61.8% retracement at $381.62. |
| Failed breakout | 25% | The 52-week high rejects price, the September 15 breakout is retraced, and the advance unwinds toward SMA20 $387.32 and the August 25 swing low at $354.88. | Trigger: a close below the 2× ATR reference at $399.45 on rising volume. Invalidation of this bearish path: reclaiming and holding $424.89. |
Probabilities are subjective estimates derived from the chart structure, not statistical forecasts.
Key Levels
| Price | Role | Basis |
|---|---|---|
| $429.47 | Resistance | Upper Bollinger band — 1.08% overhead; the statistical ceiling of the current expansion |
| $428.00 | Resistance | 52-week high — the last price-based reference on the chart |
| $424.89 | Current close | Sep 18, 2026 close; 0% anchor of the current up-swing (fibonacci anchor high) |
| $413.61 | Support | SMA5 — the first structural level beneath price; 1× ATR stop sits just below at $412.17 |
| $408.37 | Support | 23.6% retracement of the $354.88 → $424.89 swing |
| $399.45 | 2× ATR stop | Objective invalidation — 5.99% below the close |
| $387.32 | Support | SMA20 and Bollinger midline — the trend's short-term backbone; 38.2% retracement sits nearby at $398.15 |
What to Watch
- The first clean post-witching sessions. September 18's volume is not a usable baseline. The sessions from September 21 onward are the first honest read on whether real participation stayed after the index flow cleared.
- Whether $428.00 and $429.47 are cleared or rejected. The 52-week high and the upper Bollinger band sit within one ATR of each other and of the close. The reaction in that narrow band settles the continuation-versus-exhaustion question faster than any indicator.
- ADX drifting off 49.90. A reading this high is more often near a peak than a beginning. A decline while price holds is ordinary consolidation; a decline while price slips is the trend losing its structure.
- The MACD histogram against +1.503. The cross is only three sessions old and the lines are 1.503 points apart — narrow enough that a flat week would close the gap and reverse it.
- A catalyst check before anything else. No event was identified in the five-session window and none is asserted here. The absence of an identified catalyst is not the same as the absence of one; verify the news and filing record independently.
Conclusion
Past Analyses of This Stock same ticker · newest first
Other signals from this issue same publication date · 5 stocks
This analysis is an educational interpretation of chart data and is not investment advice. Probabilities and levels are subjective estimates; every investment decision, and its outcome, is your own responsibility. A bottoming signal is not a buy signal, and a breakout is not a guarantee of continuation.
Two Week Swing · twoweekswing.com · 4,600+ stocks screened weekly