Relay Therapeutics, Inc.
$19.44 −8.6% from the 52-week high ($21.27)
This analysis is based on closing-price data as of August 21, 2026. Whether you're researching how to buy Relay Therapeutics, Inc. stock or you've just opened a brokerage account and are trying to time an entry, here are objective support levels and stop-loss references built from the RSI, MACD and ATR indicators.
The two-year chart is a textbook base-to-markup sequence: a long slide into the $3.31 52-week low, roughly six months of flat-line basing, and then a sustained advance that has carried price to $19.44 — up 487.3% from that low and only 8.6% below the $21.27 52-week high set this week. Mansfield RS at +66.51% against the Nasdaq Composite says this has been one of the market's stronger performers, not a crowd-following move. The near-term picture is narrower and less settled: after tagging the 52-week high, price gave back ground for two sessions to close beneath both the 5- and 20-day averages on the heaviest volume in weeks, and the RSI reading behind that high was lower than the one behind July's. This page reads the trend and that stall side by side.
Snapshot values as of the August 21, 2026 close
| Metric | Value | Read |
|---|---|---|
| Close | $19.44 | Below SMA5 and SMA20, above SMA60 |
| 52-week high / low | $21.27 / $3.31 | −8.6% from the high, +487.3% off the low |
| SMA5 / SMA20 / SMA60 | $20.23 / $19.60 / $18.00 | Long-term stack still rising; price has slipped under the two short lines |
| Bollinger (20) upper / mid / lower | $21.03 / $19.60 / $18.18 | Band width 14.55% — mid-range, neither pinched nor blown out |
| aVWAP — 2y anchor (Jan 10, 2025) | $9.09 | Price sits far above the long-term anchor |
| aVWAP — 90d anchor (May 19, 2026) | $16.87 | Short-term buyers are also in profit, 13.2% below price |
| RSI(14) | 49.7 (90d) · 49.8 (2y) | Right on the 50 line; bearish divergence flagged on the 2y frame only |
| Mansfield RS vs the Nasdaq Composite | +66.51% | Outperform, slope falling (prior week +71.26%, prior month +84.91%) |
| MACD / signal / histogram | 0.415 / 0.493 / −0.078 | Dead cross on August 20, 2026 — but above the zero line |
| ADX(14) | 25.1 (90d) · 25.0 (2y) | Just over the strong-trend threshold — direction is set by price, not ADX |
| ATR(14) | $1.001 (5.15% of price) | A wide daily range — position sizing matters more than usual here |
| OBV state | 2y: early distribution (−0.09% vs MA20) · 90d: improving (−0.24%) | Below its MA20 on both frames, but only barely — effectively undecided |
| Volume (last / 20-day avg) | 2,965,800 / 2,207,305 — 1.34× | The give-back is happening on above-average trade, not thin trade |
| 1× / 2× ATR stop reference | $18.44 / $17.44 | −5.15% / −10.29% from the close |
① Price & Moving Averages
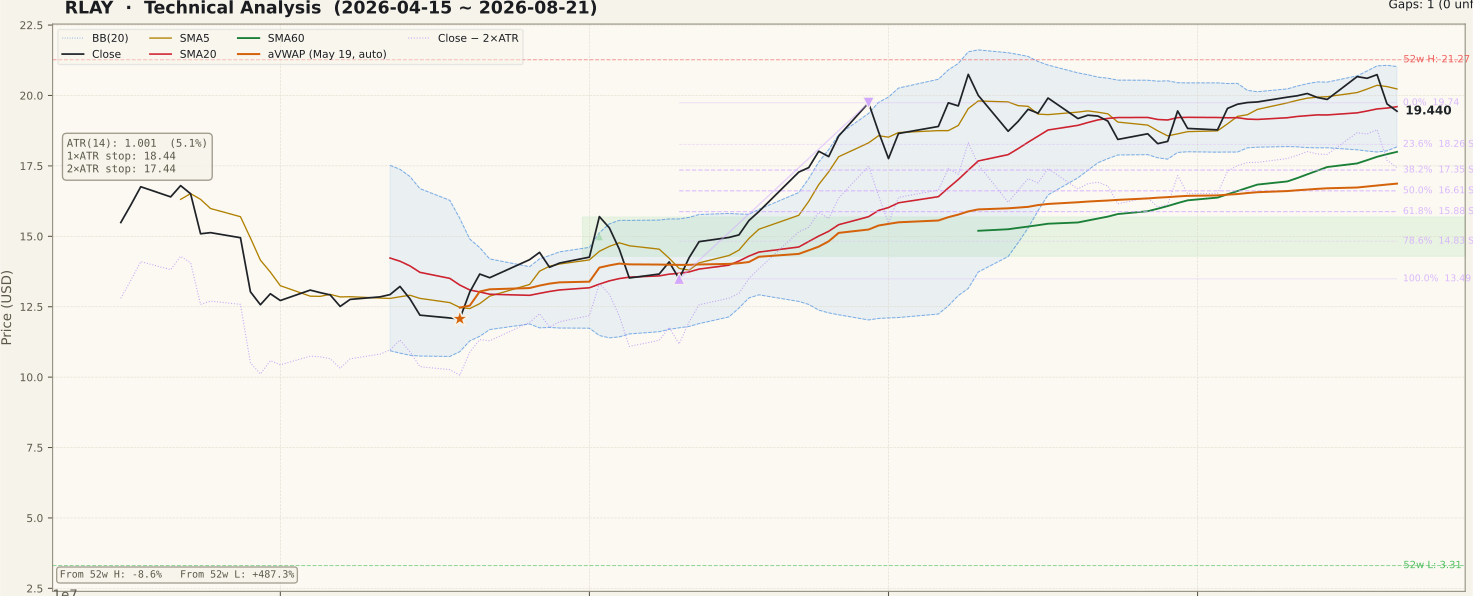
The longer-dated structure is intact and the short-dated one is not. SMA60 at $18.00 is rising and sits well beneath the market, but the close of $19.44 is below SMA20 $19.60 and further below SMA5 $20.23 — the 5-day line has rolled over toward the 20-day, which is the first mechanical sign of a short-term stall. Because the Bollinger mid-band is the same calculation as SMA20, $19.60 carries double weight as the immediate line to reclaim; the upper band at $21.03 sits just under the $21.27 52-week high and frames a tight overhead cluster that price ran into this week.
Both anchored VWAPs are far below price — $9.09 from the January 10, 2025 anchor on the two-year chart and $16.87 from the May 19, 2026 anchor on the 90-day chart — so the average buyer from either anchor is comfortably in profit and under no pressure to sell. Retracement levels measured across the June swing (low $13.49 on June 10 to high $19.74 on June 29) put the 0% line at $19.74 as overhead reference and the 23.6% line at $18.26 as the first retracement shelf; that shelf sits almost on top of the $18.18 lower band and the $18.00 SMA60, stacking three independent lines into one zone. Neither timeframe carries an unfilled gap, so there is no obvious magnet pulling price in either direction.
② Volume

Friday traded 2,965,800 shares against a 20-day average of 2,207,305 — 1.34× normal. That is the detail worth pausing on: through most of August the volume bars and their 20-day average were shrinking as price ground higher, and the largest bar of the recent stretch arrived on a down session rather than on the push to the 52-week high. Advances that thin out and give-backs that thicken are the opposite of what a healthy continuation looks like.
The context is less alarming than that sentence alone suggests. The 90-day panel shows genuine 2×-plus spikes clustered through May, June and early July — the sessions that built the advance — so heavy trade has previously shown up on the buy side in this name. One 1.34× session does not establish distribution, and 1.34× is a long way from the 3× threshold that would mark a true capitulation or news event. Treat it as a caution flag on the last two sessions, not as a verdict on the trend.
③ MACD

MACD registered a dead cross on August 20, 2026, with the MACD line at 0.415 now under its signal at 0.493 and the histogram at −0.078. The qualifier that matters is where the cross happened: both lines remain above zero, which makes this a loss of momentum inside a trend rather than a trend reversal signal. Crosses that occur well beneath the zero line carry much more weight than this one.
The 90-day panel also shows how choppy this indicator has been for RLAY lately — a run of golden and dead crosses in quick succession through August as the two lines converged and hovered near 0.5 together. Clustered crosses are what MACD produces during sideways price action, and they are the classic trap for newer traders who treat each one as a fresh signal. The reading to watch is not the next cross but whether the histogram, currently marginally negative, can turn back positive without the lines first dropping through zero.
④ RSI

RSI sits at 49.7 on the 90-day frame and 49.8 on the two-year frame — the neutral line, reached by a sharp drop from the mid-60s over the last two sessions. Neither overbought nor oversold, so RSI on its own offers no edge here; what it does say is that the momentum cushion built during the August advance has been spent.
The two timeframes disagree about divergence, and that disagreement is informative rather than a data error. The 90-day panel reports none; the two-year panel flags a regular bearish divergence between July 17, 2026 ($19.91, RSI 66.30) and August 19, 2026 ($20.74, RSI 65.76) — a higher high in price against a marginally lower high in RSI. The gap between those two RSI readings is 0.54 points, which is about as slender as a divergence can be while still qualifying, and the 90-day window is simply too short to contain the July peak. A divergence is a possibility of a top, never a confirmation: it is only meaningful once price also fails at a level, and it is erased outright if RSI drives back above 66.30 on a new high.
⑤ Mansfield Relative Strength

Mansfield RS reads +66.51% against the Nasdaq Composite — deep in outperform territory, and the single most supportive number on this page. The two-year panel shows the line spending all of late 2024 and most of 2025 below zero before crossing into positive territory in the autumn of 2025 and staying there since; that crossover is what separates a bounce off a low from a genuine change of leadership.
The slope is the caveat. The prior-week reading was +71.26% and the prior-month reading was +84.91%, so the weekly change is −4.75 points and the monthly change is −18.39 points. In positive territory a negative change means slowing outperformance, not underperformance — RLAY is still beating the index, just by a narrowing margin, and from +66.51% there is a great deal of room before zero is anywhere in question. Deceleration this far above the line is a normal feature of a consolidation, but it is worth tracking because sustained deceleration is how leadership eventually ends.
⑥ ATR & ADX

ATR(14) is $1.001, or 5.15% of the $19.44 close. That is a wide daily range — a single average session moves this stock about five percent — and it is the reason the stop references sit as far away as they do: $18.44 at 1× ATR (−5.15%) and $17.44 at 2× ATR (−10.29%). A stop placed tighter than roughly one ATR in a name with this range profile is inside the noise and will be triggered by ordinary daily movement rather than by a change in structure.
ADX(14) reads 25.1 on the 90-day frame and 25.0 on the two-year frame — just over the 25 line that separates a strong trend from a forming one. ADX measures strength, not direction, so the number by itself does not vote bullish or bearish. The shape matters more than the level: the 90-day panel shows ADX drifting down from the high-30s in the spring toward this threshold while ATR has eased from about $1.25 in July to $1.00 now. Falling trend strength and falling volatility together are the fingerprint of a consolidation, which is consistent with what price has done since early July.
⑦ On-Balance Volume

The two timeframes carry different tags and both should be read. On the 90-day frame OBV is tagged improving — 29,082,100 against an MA20 of 29,151,035, so 0.24% below the average but with a rising slope. On the two-year frame it is tagged early distribution — 74,889,800 against 74,958,735, 0.09% below the average with a flat slope. Neither gap is meaningful in itself; OBV is sitting on its own moving average on both frames.
The honest conclusion is that accumulation and distribution are unresolved here, and a reader would be over-reading the chart to claim either. What can be said is what the two-year panel shows visually: OBV climbed hard and consistently from the autumn of 2025 through July 2026, tracking the price advance, and has flattened out in August alongside price. That is the volume signature of a pause, and it neither confirms the divergence flagged in RSI nor refutes it.
Bull vs Bear
Bull Case
- Mansfield RS +66.51% versus the Nasdaq Composite — sustained leadership since the line crossed above zero in autumn 2025.
- Price is +487.3% off the $3.31 52-week low, with SMA60 at $18.00 still rising underneath.
- Both anchored VWAPs sit far below price ($9.09 2y, $16.87 90d) — no cohort of buyers is trapped at a loss.
- The MACD dead cross occurred above the zero line, with both lines still positive at 0.415 and 0.493.
- 90-day OBV is tagged improving with a rising slope, only 0.24% under its MA20 — the fade has not broken the volume trend.
- The August 19 push made a new 52-week high at $21.27; the range top was tested, not rejected from a lower high.
Bear Case
- Price at $19.44 is 6.3% below the August 19 close of $20.74 and now sits under both SMA5 $20.23 and SMA20 $19.60.
- The give-back came on 1.34× average volume — the heaviest session of the recent stretch landed on a down day.
- Regular bearish RSI divergence on the two-year frame: $19.91 / RSI 66.30 (Jul 17) versus $20.74 / RSI 65.76 (Aug 19).
- MACD dead cross dated August 20, 2026, with the histogram negative at −0.078.
- Mansfield RS slope is falling: −4.75 points week over week and −18.39 over the month.
- Two-year OBV is tagged early distribution and flat, and ADX has slid from the high-30s toward the 25 threshold — trend strength is draining.
Scenarios
| Scenario | Probability | Path | Trigger / Invalidation |
|---|---|---|---|
| Consolidation, then continuation | 40% | Price holds the $19.60–$18.26 band, works off the overbought condition sideways, then reclaims SMA5 $20.23 and revisits $20.74 and the $21.03–$21.27 overhead cluster. | Trigger: a close back above $20.23 on volume above the 2,207,305 twenty-day average. Invalidated on a close below $18.26. |
| Deeper retracement into the shelf | 40% | SMA20 gives way and price works down into the $18.26–$18.00 zone where the 23.6% retracement, the $18.18 lower band and SMA60 stack together — the natural test of the June breakout base. | Trigger: a close below $19.60. This path resolves bullishly if the zone holds and price reclaims $20.23; it fails on a close below $17.44. |
| Trend break | 20% | SMA60 and the 2× ATR reference both give way, opening the 38.2% retracement at $17.35 and the 50% level at $16.61, with the $16.87 90-day anchored VWAP inside that band. | Trigger: a close below $17.44, ideally confirmed by Mansfield RS turning down through the range it has held since spring. Invalidated by a reclaim of $18.26. |
Key Levels
| Level | Role | Basis |
|---|---|---|
| $21.27 | Resistance | 52-week high, set August 19, 2026; the $21.03 Bollinger upper band sits just beneath it |
| $20.23 | Resistance | SMA5 — the first line price must reclaim to end the short-term stall |
| $19.74 | Resistance | 0% of the June swing (June 29, 2026 high) — the anchor the fibonacci grid is measured from |
| $19.60 | Support / pivot | SMA20 and the Bollinger mid-band at the same value — price closed just beneath it |
| $19.44 | Current close | August 21, 2026 close |
| $18.26 | Support | 23.6% retracement of the June swing; the $18.18 lower band and $18.00 SMA60 stack immediately below |
| $17.44 | 2× ATR stop reference | Objective invalidation — 2× the $1.001 ATR below the close, −10.29% |
What to Watch
- $19.60, then $18.26. SMA20 doubles as the Bollinger mid-band, so it is the first structural line; below it the 23.6% retracement, the $18.18 lower band and the $18.00 SMA60 form a three-line shelf that is the real test.
- Whether volume follows direction. Friday's 1.34× session was a down day; a reclaim of $20.23 on below-average trade would be the kind of unconfirmed breakout that traps buyers, while heavy trade on further downside would turn the two-year OBV tag from early distribution into something firmer.
- The RSI divergence. It is erased if RSI drives back above the 66.30 reading that accompanied the July 17 high, and it only becomes meaningful if price also fails at $19.60 or lower.
- The MACD histogram at −0.078. Watch whether it turns back positive with both lines still above zero, or whether the pair rolls through the zero line first — the second is a materially different signal.
- Mansfield RS deceleration. The weekly change is already −4.75 points; the question is whether it flattens out well above zero, as it has during previous pauses, or keeps compressing.
Conclusion
Past Analyses of This Stock same ticker · newest first
Other signals from this issue same publication date · 6 stocks
This analysis is an educational interpretation of chart data and is not investment advice. Probabilities and levels are subjective estimates; every investment decision, and its outcome, is your own responsibility. Chart indicators describe what price has already done — they cannot account for company news, earnings or regulatory events that have not yet occurred.
Two Week Swing · twoweekswing.com · 4,600+ stocks screened weekly