Avalo Therapeutics, Inc.
$19.83 −18.3% from the 52-week high ($24.27)
This analysis is based on closing-price data as of August 21, 2026. Whether you're researching how to buy Avalo Therapeutics, Inc. stock or you've just opened a brokerage account and are trying to time an entry, here are objective support levels and stop-loss references built from the RSI, MACD and ATR indicators.
Two years of data show a stock that spent late 2024 and the first half of 2025 sliding toward the $8.65 52-week low, then rebuilt through the autumn and, in early May 2026, spiked to a $24.27 52-week high before giving the entire move back within five weeks. What has happened since is quieter and, for chart purposes, more useful: a steady rebuild off the June 8 low at $12.74 into a six-week shelf, an August 19 close of $20.75 that cleared the top of that shelf, and two sessions of give-back to $19.83 on 0.75× average volume. The moving averages are stacked and rising (SMA5 $20.01 > SMA20 $19.30 > SMA60 $17.66) and Mansfield RS sits well above zero at +13.59% versus the Nasdaq Composite. This page reads that shallow pullback against the heavy overhead supply the May round trip left behind.
Snapshot values as of the August 21, 2026 close
| Metric | Value | Read |
|---|---|---|
| Close | $19.83 | Just below SMA5, above SMA20 and SMA60 |
| 52-week high / low | $24.27 / $8.65 | −18.3% from the high, +129.2% off the low |
| SMA5 / SMA20 / SMA60 | $20.01 / $19.30 / $17.66 | Bullish stack, all rising; price 0.9% under the 5-day line |
| Bollinger (20) upper / mid / lower | $20.65 / $19.30 / $17.95 | Band width 13.97% — moderate, neither pinched nor stretched |
| aVWAP — 2y anchor (Mar 11, 2025) | $16.41 | Price well above the long-term anchor |
| aVWAP — 90d anchor (Jun 18, 2026) | $18.25 | Short-term buyers from the June rebuild are also in profit |
| RSI(14) | 55.3 | Neutral-positive; no divergence detected on either timeframe |
| Mansfield RS vs the Nasdaq Composite | +13.59% | Outperform, slope tagged falling (prior week +11.03%, prior month +15.61%) — up 2.55 points week-over-week, down 2.02 month-over-month |
| MACD / signal / histogram | 0.471 / 0.433 / +0.038 | Golden cross on August 12, 2026; both lines above zero but barely separated |
| ADX(14) | 23.1 (2y) · 23.4 (90d) | Emerging trend strength — direction is set by price, not ADX |
| ATR(14) | $1.112 (5.61% of price) | Roughly a $1.11 average daily range — a wide-swinging stock |
| OBV state | 2y: early accumulation (+1.69% vs MA20) · 90d: early accumulation (+2.06%) | Above its MA20 on both timeframes, but the slope is tagged flat |
| Volume (last / 20-day avg) | 569,800 / 759,825 — 0.75× | The give-back is happening on below-average trade |
| 1× / 2× ATR stop reference | $18.72 / $17.61 | −5.61% / −11.22% from the close |
① Price & Moving Averages
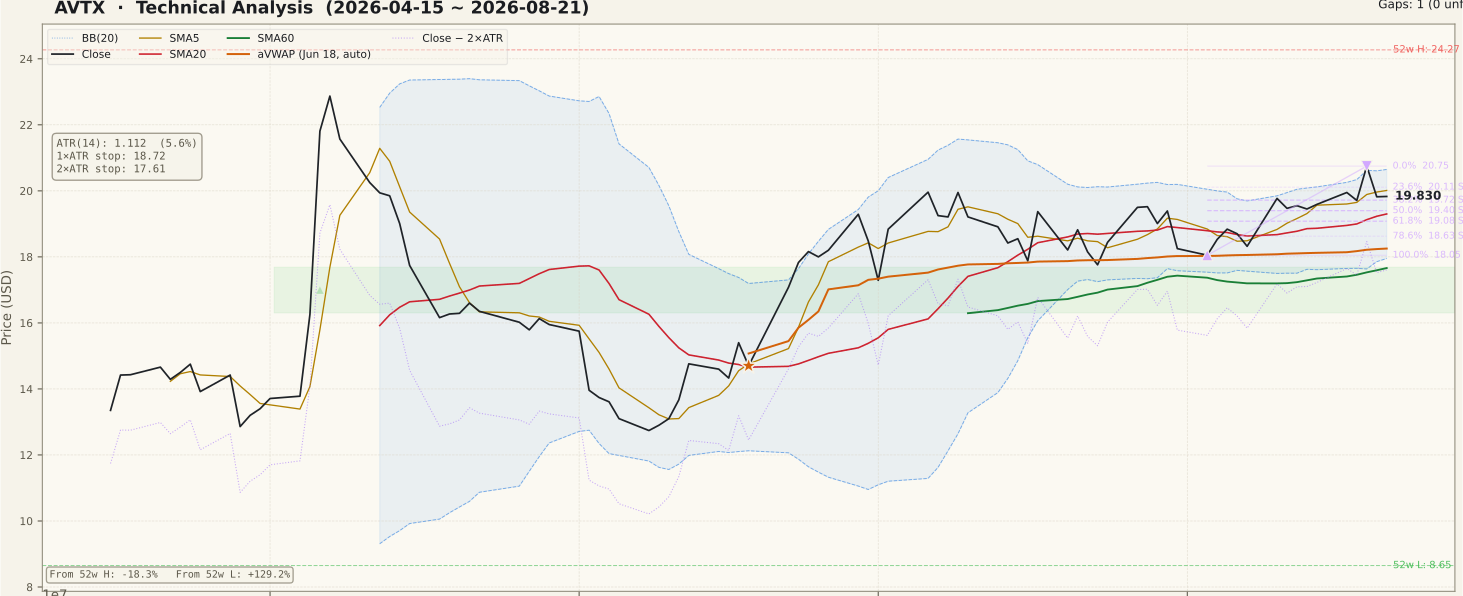
The moving-average structure is constructive: SMA5 $20.01 sits above SMA20 $19.30, which sits above SMA60 $17.66, and all three slope upward. Price at $19.83 has slipped just beneath the 5-day line — a 0.9% gap — while holding comfortably above the 20- and 60-day averages. That is the shape of a pause inside an advance rather than a break of one, which is why this name surfaced in the pullback bucket of the weekly screen. The Bollinger mid-band coincides exactly with SMA20 at $19.30, so that figure carries double weight as the first structural line beneath the market, while the upper band at $20.65 sits just under the August 19 close of $20.75 — a tight overhead pair.
Both anchored VWAPs are below price — $16.41 from the March 11, 2025 anchor on the two-year chart and $18.25 from the June 18, 2026 anchor on the 90-day chart — so the average buyer from either anchor point is in profit and under no forced-selling pressure. Retracement levels from the August 3 low ($18.05) to the August 19 high ($20.75) put the 23.6% line at $20.11 and the 38.2% line at $19.72; Friday's close of $19.83 is wedged between them, which is a shallow give-back so far. On the two-year swing from the April 28 low ($12.86) to the May 7 high ($22.87), price sits between the 38.2% line at $19.05 and the 23.6% line at $20.51. The one unfilled gap on the two-year chart is far below at $12.00–$12.50 from September 29, 2025 — context rather than a working level. What matters more from that longer window is supply: the May 5–7 spike to $24.27 was fully retraced to $12.74 by June 8, leaving a band of buyers between roughly $20 and $24 who are still underwater.
② Volume

Friday's 569,800 shares against a 759,825 twenty-day average is 0.75× — the pullback is happening on thin trade. Read plainly, that says sellers are absent rather than aggressive, which is the more benign of the two ways a stock can drift lower. The caveat is the mirror image: the August 19 push to $20.75 also arrived on 999,000 shares, only about 1.3× the average, so the breakout of the six-week shelf was not confirmed by any real expansion in participation. A breakout that nobody shows up for is exactly the pattern beginners tend to over-trust.
The 90-day panel is dominated by the early-May bar, when 22,460,600 shares changed hands in a single session — roughly thirty times the current average. That episode is nearly four months old and sits well outside any recent window, but its footprint still shapes the volume scale and the overhead supply discussed above. Since mid-July, daily turnover has settled into a much narrower band, and the 20-day average itself has been drifting lower — a quiet tape, not a distribution tape.
③ MACD

MACD printed a golden cross on August 12, 2026 and both lines are above zero — 0.471 for MACD against 0.433 for the signal. The direction is right, but the magnitude is not impressive: the histogram is only +0.038, which means the two lines are almost touching. Crosses this tight are the ones most likely to be reversed by a couple of flat sessions, so the honest read is "improving, unconfirmed" rather than "momentum established."
The two-year panel gives that cross its context. MACD has whipsawed repeatedly through 2026 — several crosses in each direction since April — so a single cross on this chart has a poor track record as a standalone signal. The constructive detail is that this cross occurred above the zero line rather than deep below it, which places it inside an existing uptrend instead of at the start of a speculative turn.
④ RSI

RSI(14) reads 55.3 — above the 50 midline, nowhere near the 70 overbought threshold, and a long way from the 30 oversold band. That is a neutral-positive reading with room in both directions, and it is consistent with a stock that has advanced without becoming stretched. Both JSON sidecars report no divergence, and the peak fields are null, so no divergence is claimed here; the chart annotation agrees with "No divergence detected."
Across the 90-day window RSI has held above 50 since late June with a single brief tag of the 70 line in mid-July, and it has spent the August range oscillating in the low-to-mid 50s. A mid-range RSI is the least informative reading an oscillator can give — it neither supports nor contradicts the pullback thesis, and it should not be used on its own to time an entry. Its value here is negative confirmation: there is no overbought condition to unwind.
⑤ Mansfield Relative Strength

Mansfield RS stands at +13.59% versus the Nasdaq Composite — AVTX is a Nasdaq listing, so the benchmark is the Composite (^IXIC), not the S&P 500. The reading is well inside outperform territory and identical on both timeframes, as it should be for an anchor-free measure. The two prior readings tell a split story: a week ago RS stood at +11.03%, so the weekly change is +2.55 points — positive and accelerating. A month ago it stood at +15.61%, so the monthly change is −2.02 points — still positive, but slowing over the longer horizon. The JSON slope tag reflects that longer view and reads "falling."
The two-year panel puts the level in perspective: RS spent most of 2025 deep in negative territory, crossed zero in August 2025, and peaked near +90 in the December 2025 to January 2026 stretch before fading. The current +13.59% is a fraction of that peak. Read together, the stock is beating its index but by a far narrower margin than it did eight months ago, and the recent one-week improvement is the first sign of that margin widening again rather than a return to leadership.
⑥ ATR & ADX

ATR(14) is $1.112, or 5.61% of the $19.83 close. That is a wide daily range and it is the single most important number on this page for position sizing: a stop placed at a conventional 2× ATR sits at $17.61, fully 11.22% below the close. Anyone framing risk on this chart has to accept that distance or accept a tighter stop that ordinary daily noise can trigger. The 1× ATR reference at $18.72 is −5.61% and is best treated as a volatility yardstick rather than a stop.
ADX(14) reads 23.1 on the two-year chart and 23.4 on the 90-day — the 20–25 zone the tool labels "emerging." A trend is forming but has not reached the ADX 25 threshold that marks a strong one, and ADX says nothing about direction: a high reading during a decline means a strong decline. Combined with a decaying ATR — the 90-day panel shows volatility compressing steadily since the May spike — the picture is a stock settling down rather than accelerating.
⑦ On-Balance Volume

OBV is tagged early accumulation on both timeframes, which is the honest label for what the panel shows. On the two-year chart OBV sits at 30,474,700 against an MA20 of 29,968,235 — 1.69% above it. On the 90-day chart it is 25,150,900 against 24,644,435, or 2.06% above. Being above the average is the constructive part; the margins are thin and the slope is tagged flat on both, so this is not a picture of decisive buying.
The 90-day panel makes the flatness visible: OBV jumped vertically on the early-May session, drifted lower into June, and has since traced a slow, almost horizontal path while price climbed from $12.74 to $19.83. Price making higher highs while OBV merely holds its average is a non-confirmation — not a bearish signal on its own, but a reason not to treat the August 19 breakout as demand-driven until OBV starts making its own higher highs.
Bull vs Bear
Bull Case
- Bullish moving-average stack — SMA5 $20.01 > SMA20 $19.30 > SMA60 $17.66, all rising, with price only 0.9% under the 5-day line.
- Mansfield RS at +13.59% versus the Nasdaq Composite, clearly above zero and up 2.55 points week-over-week (from +11.03%).
- Both anchored VWAPs sit below price — $16.41 (Mar 11, 2025 anchor) and $18.25 (Jun 18, 2026 anchor) — so buyers from either anchor are in profit.
- MACD golden cross on August 12, 2026 with both lines above zero, placing the turn inside an existing uptrend rather than at a speculative bottom.
- OBV above its MA20 on both timeframes (+1.69% on 2y, +2.06% on 90d), tagged early accumulation.
- The August 19 close of $20.75 cleared the top of a six-week closing range, and the give-back since has come on 0.75× average volume.
Bear Case
- Heavy overhead supply: the May 5–7 advance to the $24.27 52-week high was fully retraced to $12.74 by June 8, leaving trapped buyers across roughly $20–$24.
- The MACD histogram is only +0.038 — the lines are almost overlapping, and a cross this tight is easily reversed.
- Mansfield RS slope is tagged falling and the monthly change is −2.02 points (+15.61% to +13.59%); the current level is a fraction of the December–January peak.
- OBV slope is flat on both timeframes and only 1.69%/2.06% above its MA20 — price made higher highs that OBV has not confirmed.
- ADX at 23.1/23.4 is only "emerging," below the 25 threshold, so there is no strong trend to lean on.
- ATR is 5.61% of price, which puts an objective 2× ATR stop 11.22% away at $17.61 — a wide invalidation distance for a $19.83 stock.
Scenarios
| Scenario | Probability | Path | Trigger / Invalidation |
|---|---|---|---|
| Shallow pullback holds, breakout retested | 48% | Holds the $19.72 (38.2%) shelf or the $19.30 SMA20, then works back through $20.11 toward $20.75 and the $20.65 upper band. | Trigger: a close back above $20.11 on volume above the 759,825 average. Invalidation: a daily close below $19.30. |
| Deeper give-back into the August base | 34% | The thin MACD cross rolls over; price works through $19.40 and $19.08 toward the $18.63 (78.6%) line and the $18.05 August 3 swing low, where SMA60 $17.66 and the $17.95 lower band sit just beneath. | Trigger: consecutive closes below $19.40. Invalidation: a reclaim of $20.11. |
| Breakout fails back into the July range | 18% | $18.05 gives way and price returns to the mid-July shelf near $17.76, the same area as the $17.61 2× ATR reference and the $17.66 SMA60 — putting the whole August advance back on the table. | Trigger: a close below $17.95 (lower Bollinger band). Invalidation: recovery of the $19.30 SMA20 and mid-band. |
Key Levels
| Price | Role | Basis |
|---|---|---|
| $20.75 | Resistance | August 19, 2026 close and the 0% anchor of the current retracement swing — the level that cleared the six-week range |
| $20.65 | Resistance | Upper Bollinger band (20), sitting just under the swing high — a tight overhead pair |
| $20.01 | Resistance | SMA5 — the immediate line overhead; price closed 0.9% beneath it |
| $19.83 | Current close | August 21, 2026 close |
| $19.72 | Support (fib) | 38.2% retracement of the August 3–19 advance — the first shelf directly beneath price |
| $19.30 | Support | SMA20 and Bollinger mid-band together, with the 50% retracement at $19.40 just above — the structural line for this move |
| $17.61 | 2× ATR stop | Objective invalidation, −11.22% from the close; effectively the same shelf as SMA60 $17.66 and the $17.95 lower band |
What to Watch
- Whether $20.11 (23.6% retracement) and then $20.75 are reclaimed, and on what volume — a reclaim on less than the 759,825 average repeats the unconfirmed breakout of August 19.
- The $19.30 SMA20 and Bollinger mid-band, which coincide exactly. Losing that pair on a closing basis is what separates a shallow pause from a failed breakout.
- The MACD histogram at +0.038 — whether it widens from here or crosses back below zero, which would erase the August 12 signal.
- Mansfield RS versus the Nasdaq Composite: the weekly change has turned positive (+2.55 points) while the monthly is still negative (−2.02). Which of the two horizons wins over the next fortnight decides whether the outperformance is rebuilding or eroding.
- OBV: it is only 1.69%–2.06% above its MA20 with a flat slope. A push to new OBV highs alongside price would be the confirmation this advance currently lacks.
Conclusion
Past Analyses of This Stock same ticker · newest first
Other signals from this issue same publication date · 6 stocks
This analysis is an educational interpretation of chart data and is not investment advice. Probabilities and levels are subjective estimates; every investment decision, and its outcome, is your own responsibility. Chart indicators describe what price has already done — they cannot account for company news, earnings or regulatory events that have not yet occurred.
Two Week Swing · twoweekswing.com · 4,600+ stocks screened weekly