Delek US Holdings, Inc.
$71.47 −0.74% from the 52-week high of $72.00
This analysis is based on closing-price data as of August 21, 2026. Whether you're researching how to buy Delek US Holdings, Inc. stock or you've just opened a brokerage account and are trying to time an entry, here are objective support levels and stop-loss references built from the RSI, MACD and ATR indicators.
DK ends the week at a two-year closing high, $0.53 under the $72.00 52-week high, with a fully stacked moving-average sequence and a Mansfield RS of +59.7% against the S&P 500. The important caveat is how the level was reached: the Friday session alone added +11.60% on 2.36× average volume, while the four sessions before it netted lower — this is a one-bar breakout, not a multi-week base that resolved. RSI adds a second reservation, printing 63.46 against 81.20 at the July 21 swing high even though price is now higher. The lens for the weeks ahead is confirmation: does the move get extended on real volume, or was Friday a single repricing session.
Snapshot as of August 21, 2026 close
| Metric | Value | Read |
|---|---|---|
| Close | $71.47 | Two-year closing high |
| 52-week high / low | $72.00 / $21.09 | −0.74% from high · +238.88% from low |
| SMA5 / SMA20 / SMA60 | $67.45 / $64.99 / $56.17 | Close > 5 > 20 > 60 — full bullish stack |
| Bollinger (20,2) | $71.92 / $64.99 / $58.07 | Close $0.45 under the upper band · width 21.31% |
| aVWAP — 90d | $62.00 | Anchor Jun 29, 2026 · price above |
| aVWAP — 2y | $40.21 | Anchor Aug 22, 2025 · price above |
| RSI(14) | 63.46 | Below 70, but bearish divergence flagged |
| Mansfield RS vs S&P 500 | +59.73% | Outperform · week +12.88 · month +2.64 |
| MACD / Signal / Hist | 2.432 / 2.400 / 0.032 | Golden cross Aug 21, histogram barely positive |
| ADX(14) | 23.35 | Emerging — under the 25 strong-trend line |
| ATR(14) | $3.71 (5.19% of price) | Elevated volatility |
| OBV — 2y / 90d | +7.64% / +17.28% vs MA20 | Early accumulation both frames · slope flat |
| Volume | 3,416,000 vs 1,446,385 avg | 2.36× the 20-day average |
| 1× / 2× ATR stop | $67.76 / $64.05 | −5.19% / −10.38% from close |
① Price & Moving Averages
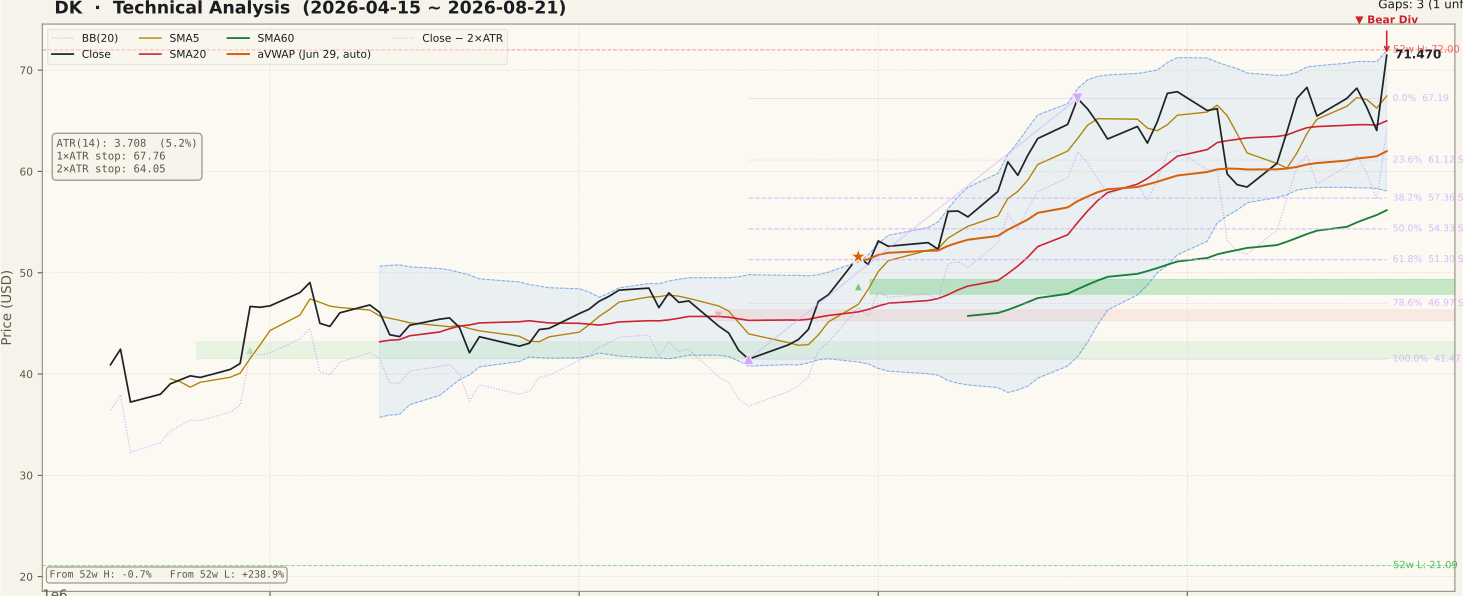
The moving-average sequence is unambiguously constructive: the $71.47 close sits above SMA5 $67.45, which sits above SMA20 $64.99, which sits above SMA60 $56.17, and all three slope up on the 90-day panel. Price is 27.2% clear of SMA60, which is the signature of a trend that has been running rather than one that is just starting. What the panel also shows is the geometry of the final bar: after the July 21 high of $67.19 the stock spent roughly a month oscillating in a $64–$68 band, then Friday's session travelled from a $64.41 low to the $72.00 52-week high in one move.
That single bar is what turned a sideways range into a breakout, and it deserves to be named as such. The close is $0.45 below the upper Bollinger band at $71.92 with band width already at 21.31%, so the move ended pressed against the top of its own volatility envelope rather than with room overhead. The Fibonacci grid is drawn from the June 18 low of $41.47 to the July 21 high of $67.19; price has now cleared the $67.19 anchor entirely, which converts that former swing high into the first structural reference beneath the market. An unfilled support gap from June 29 still sits far below at $47.87–$49.35.
② Volume

Friday traded 3,416,000 shares against a 20-day average of 1,446,385 — a ratio of 2.36×, and the tallest bar on the 90-day panel by a clear margin. Volume confirmation is the standard test for any breakout, and on the day itself this one passes: the range expansion came with participation, not on a thin tape. Beginners often stop the analysis there, but a single spike and a rising volume trend are different things.
Look at the four sessions before it — 1.43×, 1.02×, 0.64× and 1.06× — and the picture is an ordinary tape that produced one outsized session, not a steady build in participation ahead of the move. The 20-day average line itself is roughly flat across the whole 90-day window. That distinction matters for what comes next: continuation would want to see follow-through sessions holding at or above the 1,446,385 average, whereas volume collapsing back under it while price stalls near $72.00 would mark Friday as a one-off repricing rather than the start of accumulation.
③ MACD

MACD printed a golden cross on August 21 at 2.432 against a signal line of 2.400. Crossing well above the zero line is a different event from crossing up from deep negative territory — it says the momentum cycle is re-accelerating inside an existing uptrend rather than attempting a reversal from a downtrend. The 90-day panel shows the context: MACD peaked near 5 in mid-July, rolled into a dead cross, and spent August unwinding with a red histogram before Friday's bar turned it.
The reservation is the histogram itself, at 0.0319. That is a hair above zero, which means the cross is fresh and thin rather than established — the two lines are effectively touching. A cross this narrow can be undone by a single average session, so it is a signal that needs a second and third day of separation before it carries weight. The honest read is that MACD has stopped deteriorating and has turned, but has not yet demonstrated anything.
④ RSI

RSI(14) reads 63.46 — firmly in the upper half, but not overbought. The notable feature is the flagged regular bearish divergence between two specific peaks: on July 21 price closed at $67.19 with RSI at 81.20; on August 21 price closed higher at $71.47 with RSI at only 63.46. Price made a higher high while momentum made a distinctly lower one, and the gap between the two readings is wide — roughly 18 RSI points for a 6.4% higher price.
The mechanical reason is visible on the panel: RSI collapsed from the high-70s to roughly 48 during the August pullback, so Friday's surge started from a much lower momentum base than the July advance did. That is a legitimate explanation, not a dismissal — the divergence is real either way. What it is not is a top call. Divergences signal the possibility of exhaustion and can persist for weeks in a strong trend; a push in RSI above the 81.20 July peak would cancel it outright, while a rollover back under 50 would confirm it. Until price itself reverses, this stays a caution flag rather than a conclusion.
⑤ Mansfield Relative Strength

Mansfield RS stands at +59.73% versus the S&P 500 — deep in outperform territory and, on the two-year panel, near the upper end of its range since the measure crossed above zero in mid-2025. Because the reading is anchor-free it is identical on both the 2-year and 90-day frames, which is the expected behaviour and a useful consistency check.
On the quadrant test the stock is positive and accelerating on both horizons. A week ago RS was 46.85, so the weekly change is +12.88; a month ago it was 57.09, so the monthly change is +2.64. Positive territory with a positive change is acceleration. Note the tension worth holding: the panel's own slope tag still reads flat, because most of that weekly jump was manufactured by a single session rather than by a steady climb. Relative strength this high is the strongest item in the bull column, but it inherits the same one-bar dependency as the price breakout.
⑥ ATR & ADX

ATR(14) is $3.71, or 5.19% of the closing price, and the 90-day panel shows it stepping up to the top of its range on the final bar. In practical terms a typical session moves more than five percent, which directly sets the cost of being wrong: a 1× ATR reference sits at $67.76 and a 2× ATR stop at $64.05, 10.38% below the close. Position sizing has to respect that width — the same dollar risk buys materially fewer shares here than in a 2%-ATR name.
ADX(14) at 23.35 is classified as emerging, below the 25 threshold that marks a strong trend. The panel shows ADX easing down through August from a higher reading earlier in the month, even as ATR expanded. That combination — volatility rising while directional persistence fades — describes a market getting choppier rather than more decisively trending, and it is a reason to treat Friday's move as unconfirmed by trend-strength measures. ADX measures intensity, not direction; a reading under 25 simply means no side has established control.
⑦ On-Balance Volume

OBV agrees across both timeframes, which is not always the case and is worth stating explicitly. On the 2-year frame OBV is 65,710,600 against an MA20 of 61,049,095, sitting 7.64% above it; on the 90-day frame it is 31,641,900 against 26,980,395, a wider 17.28% above. Both are tagged early accumulation with the line above its moving average.
Crucially, OBV is not showing the lag that would flag a false breakout — the classic bearish non-confirmation is price at a new high with OBV failing to follow, and that is not what this panel shows. Both slopes are nonetheless tagged flat, so this is accumulation that is present but not intensifying. Read alongside the volume panel, the fair summary is that buyers have held the upper hand through the advance without any single stretch of decisive, sustained inflow.
Bull Case vs Bear Case
Bull Case
- Close of $71.47 is a two-year closing high, just 0.74% under the $72.00 52-week high.
- Full bullish stack — close > SMA5 $67.45 > SMA20 $64.99 > SMA60 $56.17, all rising.
- Mansfield RS +59.73% vs the S&P 500, positive and accelerating (+12.88 week, +2.64 month).
- MACD golden cross on Aug 21 printed at 2.432, well above the zero line — momentum re-accelerating inside an uptrend.
- OBV above its MA20 on both frames (+7.64% 2y, +17.28% 90d) with no bearish non-confirmation at the high.
- Price trades above both anchored VWAPs — $62.00 (Jun 29) and $40.21 (Aug 22, 2025) — so buyers across both horizons are onside.
Bear Case
- The breakout is one bar: +11.60% on Aug 21 alone, while the prior four sessions netted lower.
- Regular bearish RSI divergence — price $67.19 → $71.47 higher, RSI 81.20 → 63.46 lower.
- Volume 2.36× average is a single spike; the four preceding sessions ran 0.64×–1.43× and the 20-day average is flat.
- Close is $0.45 under the upper Bollinger band with width already at 21.31% — extended against its own envelope.
- ADX 23.35 is below 25, and it has been easing while ATR expands — no confirmed strong trend.
- ATR is 5.19% of price; an objective 2× ATR stop sits 10.38% away at $64.05, a wide risk unit.
Scenarios
| Scenario | Probability | Path | Trigger / Invalidation |
|---|---|---|---|
| Breakout confirms | 40% | Price holds above the $67.19 July swing high, clears $72.00 on volume at or above the 1,446,385 average, and moves into territory with no overhead reference from the past two years. | Trigger: daily close above $72.00 with volume ≥ average. Invalidation: close back below $67.19. |
| Spike digests | 40% | The one-bar gain is partly retraced toward SMA5 $67.45 and the $64.99 SMA20 / Bollinger midline while relative strength stays positive; the August $64–$68 range reasserts itself. | Trigger: two consecutive closes below $67.45. Invalidation: close above $72.00. |
| Divergence resolves lower | 20% | The bearish RSI divergence confirms, price loses the SMA20 at $64.99 and the $64.05 stop reference, and the 23.6% Fibonacci shelf at $61.12 becomes the next structural test. | Trigger: close below $64.05. Invalidation: RSI reclaims the 81.20 July peak. |
Key Levels
| Price | Role | Basis |
|---|---|---|
| $72.00 | Resistance | 52-week high — touched intraday on Aug 21 |
| $71.92 | Resistance | Upper Bollinger Band (20,2) |
| $71.47 | Current | Close, Aug 21, 2026 |
| $67.45 | Support | SMA5 |
| $67.19 | Resistance | Fibonacci 0% of the swing — Jul 21 anchor high, now cleared by price |
| $64.99 | Support | SMA20 and Bollinger midline |
| $64.05 | 2× ATR stop | Objective invalidation — 10.38% below the close |
What to Watch
- Whether $67.19 holds. The July 21 swing high was cleared in a single session; losing it back would mean the breakout bar was fully retraced and the August range is intact.
- Volume on any push through $72.00. Follow-through needs sessions at or above the 1,446,385 20-day average — a move to new highs on thin volume is the textbook unconfirmed breakout.
- RSI relative to its July peak. Above 81.20 cancels the bearish divergence; a rollover back under 50 confirms it. Between the two, it stays unresolved.
- The MACD histogram at 0.0319. It is barely positive — widening separation validates the Aug 21 cross, while a fade back below zero marks it as a false start.
- ADX crossing 25. At 23.35 and easing, trend strength has not confirmed the price move; a turn up through 25 would.
Conclusion
Past Analyses of This Stock same ticker · newest first
Other signals from this issue same publication date · 6 stocks
This analysis is an educational interpretation of chart data and is not investment advice. Probabilities and levels are subjective estimates; every investment decision, and its outcome, is your own responsibility. Chart readings describe structure that has already formed and carry no claim about future price.
Two Week Swing · twoweekswing.com · 4,600+ stocks screened weekly