PagerDuty, Inc.
$12.32 −28.7% from the 52-week high · +116.1% from the 52-week low
This analysis is based on closing-price data as of August 21, 2026. Whether you're researching how to buy PagerDuty, Inc. stock or you've just opened a brokerage account and are trying to time an entry, here are objective support levels and stop-loss references built from the RSI, MACD and ATR indicators.
The two-year panel for PD is a long decline followed by a repair: price ground down from the $17.29 52-week high through a November 2025 breakdown that left an unfilled gap between $13.02 and $14.93, bottomed at the $5.70 52-week low in the spring, and has been rebuilding ever since. The last month is the sharpest leg of that rebuild — from the July 23 swing low of $8.63 to Friday's $12.32 close is +42.8% — and it has produced something the chart has not shown once in two years: Mansfield RS above the zero line, at +0.70% against the S&P 500, with the moving averages in a full bullish stack and the latest session trading 1.80× its 20-day volume. The counterweight is that RSI printed a lower high into this close than it did on August 4, and the next real overhead feature is the November gap floor at $13.02. The lens below is a confirmed recovery leg meeting its first structural test, with a 4.48% average daily range setting the cost of being wrong.
Snapshot values as of the August 21, 2026 close
| Metric | Value | Read |
|---|---|---|
| Close | $12.32 | −28.7% from the 52-week high, +116.1% from the low |
| 52-week high / low | $17.29 / $5.70 | A very wide twelve-month range — price sits in the upper half of it |
| SMA5 / SMA20 / SMA60 | $12.03 / $11.37 / $10.10 | Full bullish stack — close above all three, each above the next |
| Bollinger (20) | $12.81 / $11.37 / $9.94 · width 25.2% | Price in the top third of a wide, expanded channel |
| aVWAP — 90d (May 29, 2026 anchor) | $9.87 | Above — the recovery cohort is well in profit |
| aVWAP — 2y (Nov 26, 2025 anchor) | $8.90 | Above — buyers from the breakdown anchor are in profit too |
| RSI(14) | 65.51 | Firm but below the 70 overbought line; a bearish divergence is flagged |
| Mansfield RS vs the S&P 500 | +0.70% | Outperform, rising; prev week −5.19, prev month −26.77 |
| MACD(12,26) | 0.5869 / signal 0.5553 / hist +0.0317 | Both lines above zero; golden cross Jul 31, 2026 still intact |
| ADX(14) | 30.52 | Strong — a trending market, direction read from price |
| ATR(14) | $0.55 (4.48% of price) | A typical session covers about half a dollar of range |
| OBV — 2y / 90d | +2.75% / +18.69% vs MA20 | Early accumulation (2y, flat) and accumulation (90d, rising) |
| Volume | 2,195,600 vs 20-day avg 1,219,340 (1.80×) | Heavy — the last session came with real participation |
| Stop references | 1×ATR $11.77 · 2×ATR $11.22 | 2×ATR sits 8.97% below the close |
① Price & Moving Averages
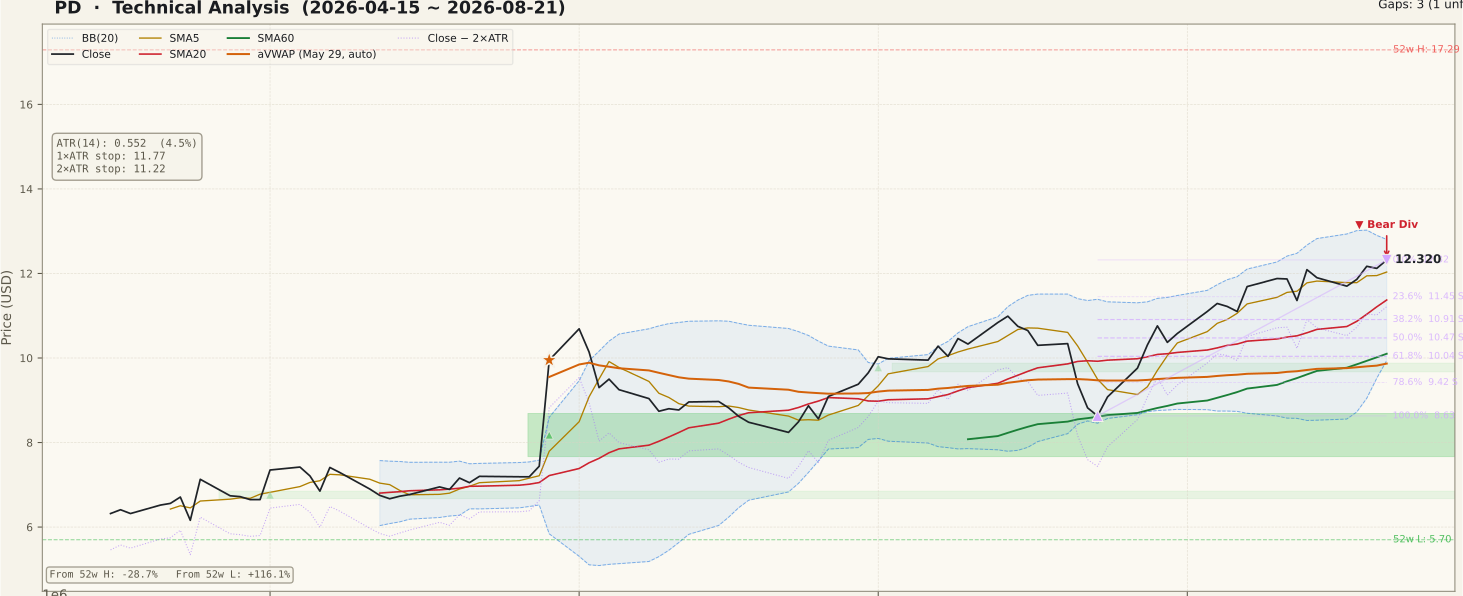
This is a clean bullish stack, the strongest configuration the price panel offers: close $12.32 > SMA5 $12.03 > SMA20 $11.37 > SMA60 $10.10, with all three averages sloping up. The 90-day panel shows how it was built — a base through May and June, a July setback that carried price back to the $8.63 low, and then a steady advance in which the 5-day line has stayed under price for most of the last three weeks. The Bollinger read needs care. Width is 25.2%, which is a wide channel rather than a squeeze, and the $12.32 close sits just under the $12.81 upper band with the $11.37 midline 7.7% below. Price riding the top of an already-expanded band is the signature of a strong trend, but it also means the distance back to the middle of the channel is no longer small. Both anchored VWAPs sit far beneath price and they should be read separately: the 90-day anchor from May 29, 2026 is $9.87 and the two-year anchor from November 26, 2025 is $8.90. Everyone who bought at either reference point is in profit, which removes a source of overhead selling that weighed on the chart through the spring. The Fibonacci grid is drawn on the up-swing from the July 23 low of $8.63 to the August 21 high anchor of $12.32, so the levels beneath price are pullback supports: $11.45 (23.6%), $10.91 (38.2%), $10.47 (50%) and $10.04 (61.8%). Above price the structure is thinner but heavier — the unfilled gap between $13.02 and $14.93 left by the November 26, 2025 session is the first genuine supply band the advance has to work through.
② Volume

The last session traded 2,195,600 shares against a 20-day average of 1,219,340 — a ratio of 1.80×, so the close that set the new swing high carried roughly 80% more participation than a normal day. That distinguishes this chart from the many recoveries that drift higher on thinning volume. The 90-day panel puts it in proportion. The dominant bar in the window is the late-May session that produced the unfilled support gap between $7.66 and $8.69, an order of magnitude larger than anything since; the August advance was built on ordinary bars until this last one. So the correct statement is that participation has just arrived, not that it has been present throughout. One caution belongs here rather than in the bull column. A single heavy session is a data point, not a trend in flow — a common beginner's error is to treat one 1.80× bar as confirmation of everything above it. What makes it meaningful is repetition: a second and third above-average day as price works toward $13.02 would say buyers are following through, while an immediate return to sub-average volume would leave this bar looking like a one-off.
③ MACD

MACD is constructive but no longer accelerating hard. The MACD line reads 0.5869 against a signal of 0.5553, the histogram is +0.0317, and the golden cross that opened this leg printed on July 31, 2026 — three weeks of the faster line holding above the slower one. Two details matter for how much weight to give it. First, both lines are well above zero, so this is momentum inside an established advance rather than an early turn off a base; the July 31 cross happened near the zero line, which is the more reliable location for a signal of this kind. Second, the histogram is thin. At +0.0317 the gap between the lines is narrow enough that a few flat sessions would close it, and the 90-day panel shows exactly that pattern earlier in the window — two prior crosses in this window resolved within a fortnight. The reading, then, is that MACD confirms the trend but is not adding to it. A widening positive histogram over the next few sessions would upgrade it; a cross back below the signal line would put the advance on notice without, by itself, breaking any price structure.
④ RSI

RSI(14) is 65.51 — firm, above the 50 midline, and still below the 70 overbought threshold. After a 42.8% advance off the July low that is a less stretched number than the price move alone would suggest. The chart flags a regular bearish divergence and the two peaks are specific: on August 4, 2026 price peaked at $11.29 with RSI at 67.61; on August 21, 2026 price made a materially higher peak of $12.32 but RSI reached only 65.51. Price made a higher high, momentum made a lower high — the textbook pattern. What it is worth is a matter of discipline. A divergence describes the rate of an advance, not its end, and this one is unusual in that its second peak is the most recent bar: nothing has happened after it yet. It is confirmed only if price now fails beneath $12.32 and breaks the structure under it, and it is nullified by a fresh high that carries RSI back above 67.61. Declaring a top from a two-peak divergence whose second peak is today's close, before either resolution has occurred, is the single most common way this signal costs money.
⑤ Mansfield Relative Strength

PD is NYSE-listed, so Mansfield RS here is measured against the S&P 500, and the reading is +0.70% — barely above zero, tagged outperform, with a rising slope. The two-year panel makes the significance clear: the line sits in the shaded underperformance zone for its entire span, reaching roughly −60 at the spring low, and only now touches the zero line from beneath. The arithmetic of the change is emphatic. A week ago RS stood at −5.19, so the weekly change is +5.89 points; a month ago it stood at −26.77, so the monthly change is +27.47 points. In positive territory with a positive change, this is accelerating outperformance — the fastest relative improvement anywhere on this page. The honest qualifier is that the level is +0.70%, not +7%. A stock one week into positive relative strength after two years below the line is a candidate for leadership, not an established leader; a single poor week against the index puts it back under zero. The distinction between a crossing and a trend is exactly what Mansfield RS is designed to make visible, and readers who treat the crossing itself as the whole signal will find it flips back more often than it holds.
⑥ ATR & ADX

ATR(14) is $0.55, which is 4.48% of the $12.32 close. In absolute terms that is a small number, but as a percentage it is high — an ordinary session moves this stock nearly 4.5%, and any stop placed inside that range will be triggered by noise rather than by a change in the chart. ADX(14) reads 30.52, above the 25 line that separates a trending market from a range. ADX measures strength and never direction, so it says only that the current move has persistence; direction comes from price, and price is above all three moving averages. The 90-day panel shows ATR stepping up in early August and holding near its highs since, so the trend is running hot rather than settling. Practically, this is what makes the stop arithmetic honest. The 1×ATR reference is $11.77 and the 2×ATR reference is $11.22, the latter 8.97% below the close. On a stock with a 4.48% daily range, 2×ATR is the minimum distance at which an invalidation level is measuring the chart instead of the noise — and it is also a reminder that position size, not stop tightness, is the tool for controlling risk here.
⑦ OBV

The two timeframes carry different tags and both are worth stating. On the 90-day view OBV is 15,279,000 against an MA20 of 12,872,940 — 18.69% above its average, rising, tagged accumulation. On the two-year view OBV is −85,171,200 against an MA20 of −87,577,260: still deeply negative in absolute terms after two years of net distribution, but 2.75% above its own average and tagged early accumulation with a flat slope. Read together they describe a turn that is real but young. Short-window flow has been positive throughout the recovery; long-window flow has only just stopped falling. That is a more accurate picture than either panel gives alone, and it matches the Mansfield RS reading of a stock one week into outperformance rather than several months in. The tension worth holding is with the RSI divergence. OBV says accumulated flow supports the advance and the latest 1.80× session added to it; RSI says the last push produced less momentum than the one before. Neither reading cancels the other — a flow-supported advance can still pause — and holding both is more useful than picking the one that matches a prior opinion.
Bull vs Bear
Bull Case
- Full bullish stack: close $12.32 > SMA5 $12.03 > SMA20 $11.37 > SMA60 $10.10, all rising.
- Mansfield RS is +0.70% and tagged outperform — above zero for the first time anywhere on the two-year panel, after +5.89 points in a week.
- The last session traded 1.80× its 20-day average (2,195,600 vs 1,219,340) — the new swing high came with participation.
- OBV is above its MA20 on both timeframes: accumulation and rising at +18.69% (90d), early accumulation at +2.75% (2y).
- MACD 0.5869 / 0.5553 with a positive histogram, both lines above zero since the July 31, 2026 golden cross.
- Price is above both anchored VWAPs ($9.87 90-day, $8.90 two-year), so neither cohort of buyers is trapped overhead.
Bear Case
- RSI bearish divergence: price rose from the August 4 peak of $11.29 to $12.32 while RSI fell from 67.61 to 65.51.
- The unfilled November 26, 2025 gap from $13.02 to $14.93 is overhead supply the advance has not yet touched.
- Price is still −28.7% below the $17.29 52-week high; the two-year chart is a downtrend with a recovery leg, not a new uptrend.
- Bollinger width is already 25.2% and price sits near the $12.81 upper band — the trip back to the $11.37 midline is 7.7%.
- Mansfield RS is only +0.70%; one weak week against the index returns it below zero.
- ATR is 4.48% of price after a 42.8% run in a month — chasing here means an $11.22 invalidation sitting 8.97% away.
Scenarios
| Scenario | Probability | Path | Trigger / Invalidation |
|---|---|---|---|
| Advance works into the gap | 40% | Price clears the $12.81 upper band, reaches the $13.02 gap floor and begins filling the November 2025 gap toward $14.93. | Trigger: a close above $13.02 with volume at or above 1,219,340. Invalidation: a close back below $11.37. |
| Pullback and reset | 35% | The divergence unwinds through time rather than price: a drift back to the $11.45–$11.37 cluster where the 23.6% retracement and SMA20 overlap, then a second attempt. | Trigger: a close below SMA5 $12.03 while $11.37 holds. Invalidation: a close beneath $10.91 (38.2%). |
| Divergence confirms | 25% | The August 21 high stands as the peak; price loses SMA20 and works down through the Fibonacci grid toward the $10.47–$10.04 zone and the rising SMA60. | Trigger: a close below $11.37 on rising volume. Invalidation: a new closing high above $12.32 that lifts RSI above 67.61. |
Key Levels
| Price | Role | Basis |
|---|---|---|
| $13.02 | Resistance | Floor of the unfilled November 26, 2025 gap ($13.02–$14.93) |
| $12.81 | Resistance | Upper Bollinger band (20) |
| $12.32 | Current close | August 21, 2026 close — also the 0% Fibonacci anchor high of the up-swing |
| $12.03 | Support | SMA5 — the fast line price has held above through the last leg |
| $11.45 | Support | 23.6% retracement of the July 23 → August 21 up-swing |
| $11.37 | Support | SMA20 and Bollinger midline |
| $11.22 | 2×ATR stop | Objective invalidation — 8.97% below the close, based on ATR(14) $0.55 |
What to Watch
- The $13.02 gap floor. The first overhead level with real structure behind it. A close above it on volume at or above the 1,219,340 average opens the November 2025 gap; a rejection there is the natural place for the RSI divergence to become visible in price.
- Whether the 1.80× session repeats. One heavy bar is a data point. A second and third above-average day as price probes higher would turn participation into a trend; an immediate drop back below average would leave the last bar isolated.
- Mansfield RS against zero. At +0.70% the crossing is one week old. Holding above the line week after week is what separates a new leader from a bounce; a return below zero removes the strongest argument on this page.
- The MACD histogram at +0.0317. Narrow enough to close in a few flat sessions. Widening confirms the advance is still adding momentum; a cross back below the signal line says it is not.
- The $11.45–$11.37 cluster. The 23.6% retracement and SMA20 sit within 0.7% of each other. A pullback that holds this band keeps the recovery structure intact; a close beneath it puts the $10.91 and $10.47 retracements in play.
Conclusion
Past Analyses of This Stock same ticker · newest first
Other signals from this issue same publication date · 6 stocks
This analysis is an educational interpretation of chart data and is not investment advice. Probabilities and levels are subjective estimates; every investment decision, and its outcome, is your own responsibility. All figures are derived from closing-price data through August 21, 2026.
Two Week Swing · twoweekswing.com · 4,600+ stocks screened weekly