Generate Biomedicines, Inc.
$16.12 −11.3% from 52-week high
This analysis is based on closing-price data as of August 21, 2026. Whether you're researching how to buy Generate Biomedicines, Inc. stock or you've just opened a brokerage account and are trying to time an entry, here are objective support levels and stop-loss references built from the RSI, MACD and ATR indicators.
GENB is a 2026 listing — the price record in this data set begins on February 27, 2026 — and in six months it has already completed one full cycle: a low of $11.00 on March 4, a 29.7% run from the May 18 washout close of $13.01 to $16.87 on June 30, a 52-week high of $18.18 printed that same session, and then a 20.2% unwind from the July 2 closing peak of $17.41 down to $13.89 on August 6. The eleven sessions since have rebuilt about 16% of that, and the August 21 close of $16.12 now sits above SMA20, SMA60 and the anchored VWAP, with an August 4 MACD golden cross behind it and Mansfield relative strength at +11.85% against the Nasdaq Composite. What the chart has not produced yet is trend strength: ADX reads 16.97, the close is back under SMA5, and the $16.90–$18.18 band directly overhead is exactly where June's advance failed.
Snapshot all values from the August 21, 2026 close
| Item | Value | Reading |
|---|---|---|
| Close | $16.12 | −11.3% from 52w high / +46.5% from 52w low |
| 52-week high / low | $18.18 / $11.00 | Upper end of the range — but the record starts Feb 27, 2026, so these are listing-to-date extremes |
| SMA 5 / 20 / 60 | $16.17 / $14.74 / $14.54 | Well above SMA20 and SMA60; the close is $0.05 under SMA5 |
| Bollinger (upper / mid / lower) | $16.86 / $14.74 / $12.63 | Band width 28.64% — close in the upper third, not walking the band |
| aVWAP (90d, anchored May 18, 2026) | $14.71 | Price 9.6% above the anchor — buyers since that session are in profit |
| aVWAP (2y, anchored May 18, 2026) | $14.71 | Same anchor on both frames — the listing history is shorter than the two-year window |
| RSI (14) | 59.9 (2y frame 59.8) | Firm but not overbought; no divergence flagged, both peak fields null |
| Mansfield RS (vs the Nasdaq Composite) | +11.85% | Above zero and accelerating: +5.03 pts on the week, +13.87 pts on the month |
| MACD (12,26) | 0.496 / signal 0.272 / hist +0.223 | Golden cross Aug 4, both lines above zero, histogram expanding |
| ADX (14) | 17.0 (2y frame 16.7) | Below 20 — ranging; the recovery has no trend character yet |
| ATR (14) | $0.96 (5.97% of price) | Wide daily range — basis for stop sizing |
| OBV | 2y: accumulation (+134.20% vs MA20, rising) / 90d: accumulation (+92.59%, rising) | Above its 20-day average and rising on both frames |
| Volume vs 20-day avg | 1.32× (830,800 vs 628,535) | Above normal, but on a modest share base |
| Unfilled gaps | None | Zero gaps flagged — no gap magnets overhead or underfoot |
| 1× / 2× ATR stop | $15.16 / $14.20 | Objective invalidation references (−6.0% / −11.9%) |
① Price & Moving Averages
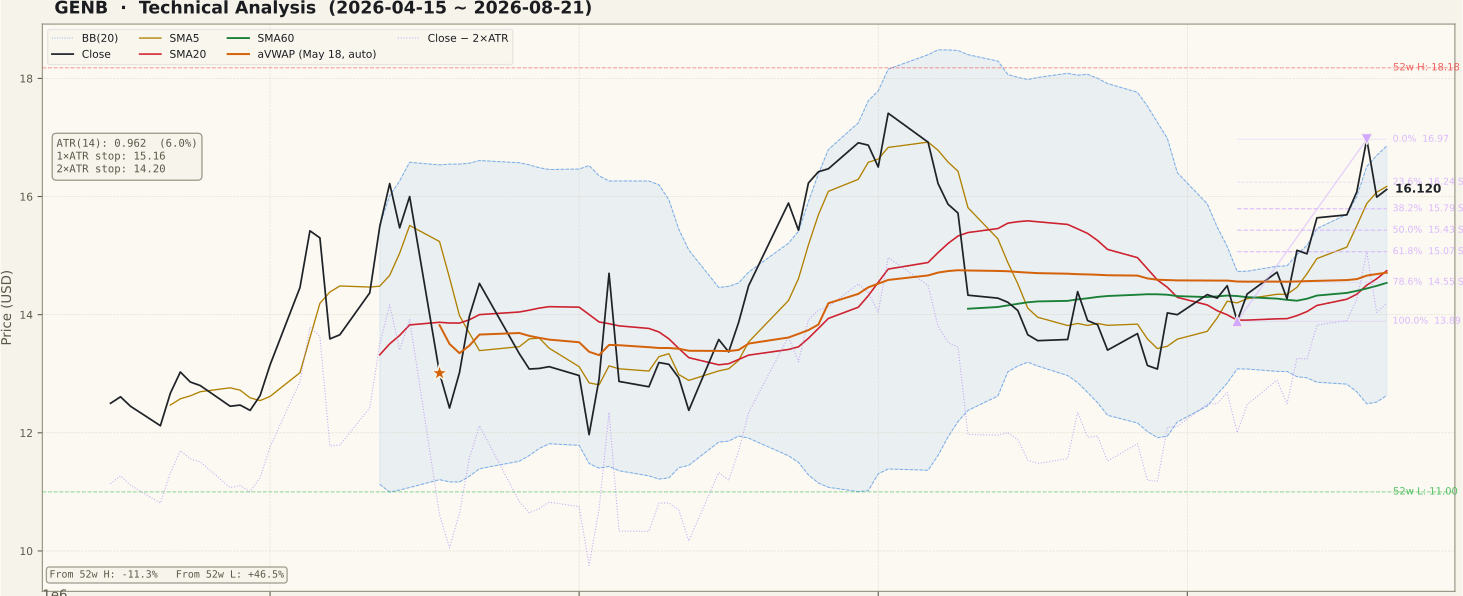
The long frame is short by construction: the data set opens on February 27, 2026 at a $12.65 close, so what the two-year panel actually shows is the stock's entire listed history. Inside that history the shape is clean — a base between the $11.00 March 4 low and roughly $14 through March and April, a violent May 18 reversal that closed at $13.01 on 1,811,100 shares, then a 29.7% advance into June 30's $16.87 close with the $18.18 high set intraday that same day. July gave it all back: from the $17.41 close on July 2 the stock slid 20.2% to $13.89 on August 6, which is where the current up swing is anchored.
The 90-day panel is where the repair shows. The close of $16.12 sits above SMA20 $14.74, SMA60 $14.54 and the anchored VWAP $14.71 — a cluster within $0.20 of itself that forms one thick shelf rather than three separate lines — but $0.05 below SMA5 $16.17, so the fastest average has rolled over after August 20's decline. That is a near-complete bullish stack with the shortest leg missing. On the Fibonacci grid of the August 6–August 19 up swing, the close has slipped just under the 23.6% retracement at $16.24; the next shelves are 38.2% at $15.79, 50% at $15.43 and 61.8% at $15.07. The Bollinger midline is the SMA20 at $14.74 and the upper band is $16.86, so price is inside the upper third of a band 28.64% wide — room above, but no band-walking to confirm a trending push.
② Volume

The August 21 session traded 830,800 shares against a 20-day average of 628,535, a ratio of 1.32×. That is the fourth consecutive above-average session: the advance into August 19 came on 1,390,000 shares, about 2.2× the average; August 20's decline on 952,700; and August 21's stabilisation on 830,800. Read that sequence honestly — the up bar carried the heaviest volume of the three, which is what a buyer-led leg looks like, but the follow-on down day was also well above average, so supply has not been absent either.
The bigger caveat is scale. A 20-day average near 630,000 shares is modest turnover, and the record is only 122 sessions long, so volume-derived readings — OBV included — rest on a thin sample and can be moved disproportionately by a single large print. Treat volume confirmation here as suggestive rather than decisive, and expect slippage on size.
③ MACD

MACD is at 0.496 against a signal line of 0.272, with the histogram at +0.223. The last cross was a golden cross on August 4 — two sessions before the August 6 price low, so the momentum turn led the price turn, which is the normal sequence when a decline is decelerating rather than accelerating.
Both lines are now above zero, so this is not an early, deep-below-zero cross; it is one that price has already ratified by recovering roughly 16% off the low. The histogram is the item to track. It is currently expanding, which supports the advance, but it is also the fastest of these readings to turn: a contraction back toward zero would mark August 19 as this leg's momentum peak well before price confirms it.
④ RSI

RSI reads 59.85 on the 90-day frame and 59.84 on the two-year frame — effectively identical, which is what should happen when the underlying series is the same. That is firm, comfortably above the 50 midline, and short of the 70 overbought threshold. The generator flagged no divergence and both divergence peak fields are null, so there is no divergence to describe here in either direction.
A reading near 60 after a 16% advance is a middling outcome and worth naming as such. It says the recovery has been steady rather than explosive, and it leaves headroom before overbought conditions become a constraint. It is also not a signal on its own: RSI in the 55–65 zone is where continuations and failed rallies alike spend most of their time.
⑤ Mansfield Relative Strength

GENB is a Nasdaq listing, so relative strength here is measured against the Nasdaq Composite. The reading is +11.85%, state outperform, slope rising, and it is anchor-free — the 90-day and two-year panels report the same value, as they should.
The trajectory is the useful part. A week ago the line stood at +6.82, so the weekly change is +5.03 points; a month ago it was −2.02, so the monthly change is +13.87 points. Both are positive readings getting more positive, which puts this in the positive-and-accelerating quadrant, and the monthly figure means the stock crossed the zero line from below within the last month. That is arguably the single most constructive item on this page: the stock is not merely rising, it is rising faster than its index, and in July it was not.
⑥ ATR & ADX

ATR is $0.96, or 5.97% of the $16.12 close — a wide daily range that has to be respected in position sizing. A 1×ATR stop sits at $15.16 (−6.0%) and a 2×ATR stop at $14.20 (−11.9%). Note what that means in practice: a single average two-day move covers the whole distance from the close to the 2×ATR line, so a stop placed any tighter than 1×ATR is inside normal daily noise for this stock.
ADX is 16.97 on the 90-day frame and 16.73 on the two-year frame — below 20 on both, which is the ranging regime, not the trending one. ADX measures the strength of a move, not its direction, so a low reading here is not itself bearish; it says the June advance, the July decline and the August recovery have cancelled one another out into a wide chop rather than laying down a directional trend. Until ADX works up through 20 and toward 25, the sensible base case is that overhead levels get respected rather than sliced.
⑦ OBV (On-Balance Volume)

OBV is tagged accumulation on both timeframes, above its 20-day average and rising on both — a case where the two frames agree completely. The 90-day reading is 4,907,600 against an MA20 of 2,548,170, a divergence of +92.59%; the two-year reading is 4,117,600 against 1,758,170, or +134.20%. Volume has been arriving on up days more than on down days through this recovery, and by a wide margin.
Two qualifications keep this from being a stronger claim than it is. First, the percentages are large partly because the base is small and the record is short, so the MA20 is easily outrun. Second, OBV confirms what price has already done; it does not forecast. The specific thing worth watching is whether OBV makes a higher high alongside any price move above $16.97 — if price gets there and OBV does not, that is the non-confirmation that would matter.
Bull Case vs Bear Case
Bull Case
- Close $16.12 is +46.5% off the 52-week low $11.00 and only 11.3% under the 52-week high $18.18.
- Price sits above SMA20 $14.74, SMA60 $14.54 and aVWAP $14.71 — every buyer since the May 18 anchor is in profit.
- MACD golden cross on August 4, both lines above zero, histogram expanding at +0.223.
- Mansfield RS +11.85% vs the Nasdaq Composite — +5.03 pts on the week and +13.87 pts on the month, having crossed zero from −2.02.
- OBV in accumulation on both frames (+92.59% 90d, +134.20% 2y), above its MA20 and rising on both.
- The recovery leg carried volume: 1,390,000 shares into the August 19 high, and 1.32× the 20-day average on the August 21 close.
Bear Case
- ADX 16.97 (2y frame 16.73) is below 20 — ranging, with no trend strength behind the advance.
- The close is back under SMA5 $16.17 and has slipped below the 23.6% retracement $16.24 after August 20's −5.8% session.
- The $16.90–$18.18 band overhead is June and July supply; August 19's $17.62 intraday high was rejected inside it.
- ATR is 5.97% of price — roughly two average sessions cover the whole distance from the close to the $14.20 stop.
- This chart has already produced one failed advance: the entire June leg was unwound by August 6, −20.2% from the July 2 close.
- Only 122 sessions of history since February 27, 2026, and a 628,535-share 20-day average — a thin base for volume, OBV and "52-week" readings alike.
Scenarios
| Scenario | Probability | Path | Trigger / Invalidation |
|---|---|---|---|
| Digestion inside the August range | ~40% | Price oscillates between the 23.6% retracement $16.24 and the $15.79–$15.43 shelf while SMA5 flattens and the MACD histogram narrows without crossing. ADX stays under 20, which is what a ranging tape looks like from the inside. | Trigger: daily closes contained inside $15.43–$16.97 with volume drifting back toward the 628,535 average. Resolved by a close outside that band in either direction. |
| Retest of the August high and the $18.18 ceiling | ~35% | Price reclaims SMA5 $16.17 and the 23.6% level $16.24, closes above the August 19 high $16.97, and works into the $16.86–$18.18 zone where the upper Bollinger Band and the June supply sit; the 52-week high $18.18 is the objective ceiling. | Trigger: a daily close above $16.97 on volume at or above the 20-day average, with the MACD histogram still expanding and OBV making a matching higher high. Invalidated by a close back under $15.79. |
| Give-back to the moving-average shelf | ~25% | The August 20 down bar turns out to be the first of a sequence: price loses $15.79 and the 50% level $15.43, then works down to the $14.54–$14.74 cluster where SMA20, SMA60 and aVWAP converge, with the August 6 low $13.89 (Fibonacci 100%) as the final structural floor. | Trigger: a daily close below $15.43 on above-average volume, with MACD crossing back under its signal line. A close below the 2×ATR stop $14.20 voids the setup outright. |
Key Levels
| Price | Role | Basis |
|---|---|---|
| $16.97 | Resistance | Fibonacci 0% of the August 6–19 up swing — the August 19 close; that session's $17.62 intraday high marks the wider rejection zone |
| $16.86 | Resistance | Upper Bollinger Band, band width 28.64%; the 52-week high $18.18 is the next ceiling above it |
| $16.24 | Pivot | Fibonacci 23.6% retracement (a support level in the swing grid) — the close is $0.12 under it, making it the first level to reclaim; SMA5 $16.17 sits just below |
| $16.12 | Current price | August 21, 2026 close — +16.1% from the August 6 low $13.89 |
| $15.79 | Support | Fibonacci 38.2% retracement; the 50% level $15.43 and the 1×ATR stop $15.16 lie immediately beneath |
| $14.74 | Support | SMA20 and Bollinger midline; aVWAP $14.71, the 78.6% retracement $14.55 and SMA60 $14.54 stack directly underneath |
| $14.20 | Stop-loss | 2×ATR stop — objective invalidation (−11.9% from the close); the August 6 low $13.89, Fibonacci 100% of the swing, lies just beneath |
What to Watch
- $16.24, then $16.97: reclaiming the 23.6% retracement and then closing above the August 19 high is the sequence that would turn this recovery into a genuine breakout attempt; failing at $16.24 keeps it a bounce inside a range.
- SMA5 at $16.17: the 5/20/60 stack is complete except for the shortest average, which the close is $0.05 under. A daily close back above SMA5 restores full alignment; further separation says August 20 started something.
- The MACD histogram at +0.223: expansion sustains the August 4 golden cross; contraction toward zero would identify August 19 as this leg's momentum peak before price confirms it.
- ADX crossing 20: at 16.97 the tape is ranging, so overhead levels should be expected to hold. A rise through 20 and toward 25 is what would change the base case from range-respecting to trend-following.
- Mansfield RS holding above zero: the line went from −2.02 a month ago to +11.85% now. Holding positive is confirmation that the August leg is more than a bounce; a slide back toward zero would remove the strongest item on this chart.
Conclusion
Past Analyses of This Stock same ticker · newest first
Other signals from this issue same publication date · 6 stocks
This analysis is an educational interpretation of chart data and is not investment advice. Probabilities and levels are subjective estimates; every investment decision, and its outcome, is your own responsibility. A bottoming or recovery signal is not a buy signal — technical readings describe what the chart has done, not what the company will do, so always weigh fundamentals and your own risk tolerance before acting.
Two Week Swing · twoweekswing.com · 4,600+ stocks screened weekly