Nordic American Tankers Limited
$6.97 −3.2% from the 52-week high
This analysis is based on closing-price data as of August 21, 2026. Whether you're researching how to buy Nordic American Tankers Limited stock or you've just opened a brokerage account and are trying to time an entry, here are objective support levels and stop-loss references built from the RSI, MACD and ATR indicators.
NAT closed Friday at $6.97, roughly 3.2% under the $7.20 52-week high it tagged intraday that same session, and about 140.3% above the $2.90 52-week low. The two-year chart shows a stock that spent late 2024 and the first half of 2025 basing in the low single digits, then built a methodical uptrend from mid-2025 onward — the moving averages have been stacked bullishly for months and Mansfield RS crossed from deeply negative into positive territory around September 2025. Near term the picture is a controlled advance rather than a vertical move: price is riding the SMA5, the MACD flipped back to a golden cross on August 14, and the OBV line sits above its 20-day average on both timeframes. The open question is confirmation — ADX is still only 20.8 ("emerging", not established) and the push to new highs has come mostly on average-or-lighter volume, so this page reads the chart through that lens: a healthy structure that has not yet proven it can hold above $7.02–$7.20.
Snapshot values as of August 21, 2026 close
| Close | $6.97 |
|---|---|
| 52-week high / low | $7.20 / $2.90 (−3.2% from high · +140.3% from low) |
| SMA5 / SMA20 / SMA60 | $6.95 / $6.55 / $6.05 (bullish stack) |
| Bollinger (20,2) | upper $7.10 · mid $6.55 · lower $6.00 (width 16.79%) |
| aVWAP — 90d | $6.26 (anchor Jun 26, 2026) |
| aVWAP — 2y | $5.79 (anchor Feb 26, 2026) |
| RSI(14) | 65.1 (upper half, below the 70 overbought line) |
| Mansfield RS vs the S&P 500 | +35.58% (outperform · prior week +30.43 · prior month +36.60) |
| MACD(12,26,9) | MACD 0.213 · signal 0.167 · histogram +0.046 (golden cross Aug 14, 2026) |
| ADX(14) | 20.8 (2y) · 21.1 (90d) (emerging trend) |
| ATR(14) | $0.242 (3.47% of price) |
| OBV — 2y | 85,698,000 vs MA20 83,718,985 (early accumulation · above MA · +2.36%) |
| OBV — 90d | 20,478,800 vs MA20 18,499,785 (early accumulation · above MA · +10.7%) |
| Volume | 3,912,100 vs 20-day average 2,852,735 (1.37×) |
| Stop references | 1×ATR $6.73 · 2×ATR $6.49 (−6.9% from the close) |
① Price & Moving Averages
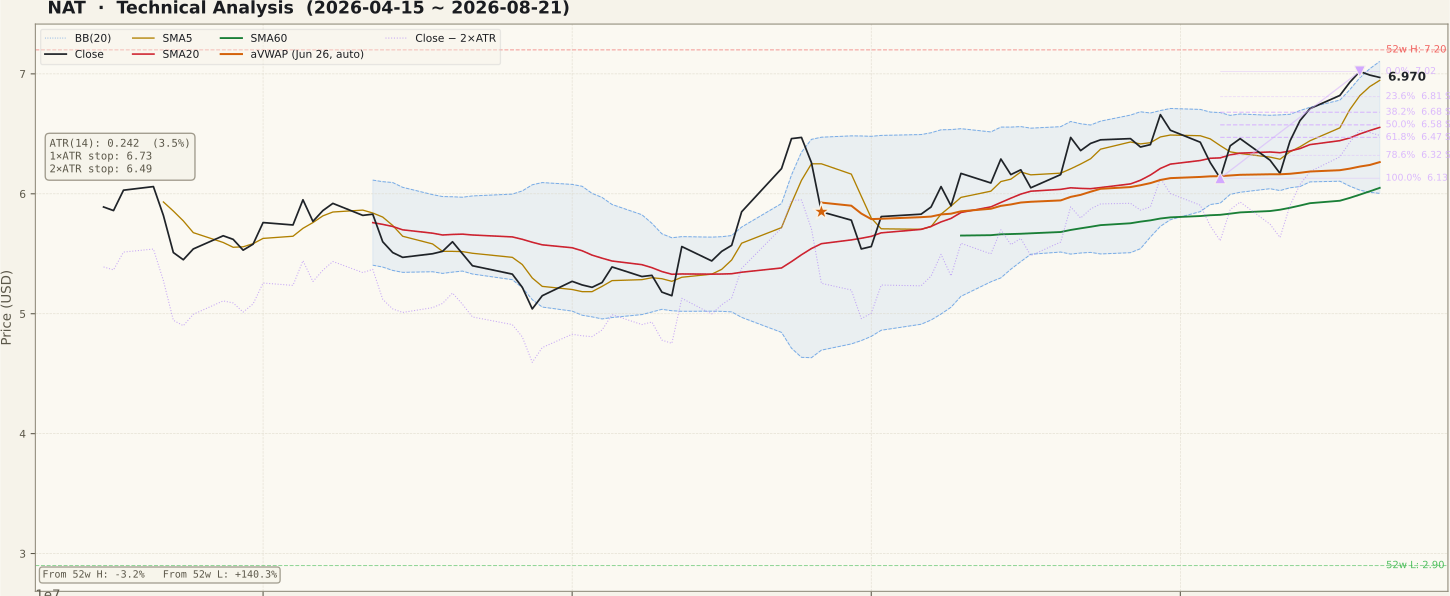
The moving-average stack is fully bullish: close $6.97 > SMA5 $6.95 > SMA20 $6.55 > SMA60 $6.05, and all three averages are sloping up. Over the past three weeks price has walked along the SMA5 rather than extending away from it, which is the shape of an orderly trend rather than a chase. The Bollinger bands are wide (16.79%) and the close is pressed near the upper band at $7.10, so upside from here is band-riding territory — powerful while it lasts, but it also means a routine pullback to the band midline at $6.55 would be a roughly 6% move with nothing broken. Both anchored VWAPs sit below price — $6.26 from the June 26 anchor and $5.79 from the February 26 anchor — so buyers from both reference points are in profit and there is little trapped supply directly overhead. Resistance is not a moving average here; it is the $7.02 swing high from August 19 and the $7.20 52-week high.
② Volume

Friday traded 3,912,100 shares against a 20-day average of 2,852,735 — 1.37×, a firm but not extraordinary print, and notable mainly because it came on the session that tagged the 52-week high. The more important detail is what preceded it: through most of August the advance ran at or below the 20-day average, and the volume average itself has been drifting lower since the late-June cluster. A move to new highs on shrinking participation is the textbook unconfirmed breakout — it does not invalidate the trend, but it is the single weakest link in the bull case here. At roughly 2.9 million shares a day against a high-$6 share price, dollar turnover is ample, so this is not a thin micro-cap where volume readings are unreliable; the caution is about conviction, not liquidity. Watch whether follow-through days can hold above the average rather than fading back under it.
③ MACD

MACD is at 0.213 with the signal line at 0.167 and a histogram of +0.046, following a golden cross on August 14, 2026. Both lines are well above the zero line, so this is a re-acceleration inside an existing uptrend rather than an early bottom signal — the distinction matters, because crosses far above zero carry less room for expansion than crosses from deeply negative territory. The 90-day panel shows the pattern clearly: a dead cross in the first week of August as price pulled back to $6.13, then the recovery cross a week later. The histogram has been rebuilding for about a week and is still growing, which is consistent with the price structure. If the histogram flattens and rolls toward zero while price sits near $7.00, that would be the first mechanical sign that this leg is running out of fuel.
④ RSI

RSI(14) reads 65.1 — firmly in the upper half, but still below the 70 overbought threshold. Through the 90-day window RSI has repeatedly based around the 50 line and turned up from there, which is the behaviour of a trending stock rather than a range-bound one; the late-June excursion above 70 was followed by digestion, not a collapse. No RSI divergence is flagged in either timeframe and no divergence peaks are recorded, so there is no evidence here of momentum failing to confirm the price highs — but equally, there is no oversold reset providing a low-risk entry point. At 65, a buyer is paying for strength that is already visible on the chart. If RSI pushes through 70 on a break of $7.20, the reading becomes a trend-confirmation signal; if it slips back under 55, the August advance has likely stalled.
⑤ Mansfield Relative Strength

Mansfield RS versus the S&P 500 stands at +35.58%, comfortably in outperform territory. Against the prior week's +30.43 that is a +5.15 point weekly gain — positive and accelerating. Against the prior month's +36.60, however, it is −1.03 points: still positive, but marginally slower than a month ago, and the reading has not returned to the roughly +75 peak the two-year panel shows in the spring. The honest summary is a stock that reclaimed market leadership last week after a summer of treading water at a lower plateau. The two-year view puts this in context — RS was between −25 and −45 for most of 2024 and the first half of 2025 before crossing zero around September 2025, so the current positive reading is the mature phase of a long relative-strength turn, not its beginning.
⑥ ATR & ADX

ATR(14) is $0.242, or 3.47% of the share price, and the 90-day panel shows it declining from about $0.30 at the start of July — volatility has been contracting while price advanced, which is generally a constructive combination. ADX(14) reads 20.8 on the two-year calculation and 21.1 on the 90-day, both tagged "emerging": above the 20 line that separates chop from directional movement, but short of the 25 level that marks an established trend. ADX measures strength, not direction, so this simply says the up-move is real but not yet forceful. For risk framing, a 2×ATR stop sits at $6.49, roughly 6.9% below the close — on a stock that routinely travels 3.5% in a day, anything tighter would be noise rather than a thesis invalidation, and position size has to be set from that distance.
⑦ OBV

Both timeframes carry the same tag — early accumulation, OBV above its 20-day average with a flat slope — but the magnitudes differ and both are worth stating. On the 90-day view OBV is 20,478,800 against an MA20 of 18,499,785, a 10.7% spread; on the two-year view it is 85,698,000 against 83,718,985, a narrower 2.36%. In other words the recent accumulation is clear in the short window and only modest against the long base, which fits a stock that spent two years being distributed and has been rebuilding since early 2026. Critically, OBV made new highs alongside price in August rather than lagging it, so there is no bearish non-confirmation on this panel. The "flat" slope tag is the caveat: the line is above its average but no longer climbing steeply, so an OBV roll under the MA20 while price holds near $7.00 would be an early warning worth respecting.
Bull Case vs Bear Case
Bull Case
- Full bullish alignment — close $6.97 > SMA5 $6.95 > SMA20 $6.55 > SMA60 $6.05, all rising.
- Price is only 3.2% below the $7.20 52-week high and +140.3% off the $2.90 low — a long-base recovery, not a bounce.
- Mansfield RS +35.58% vs the S&P 500, up +5.15 points on the week — leadership re-accelerating.
- MACD golden cross on Aug 14 with MACD 0.213 over signal 0.167 and a still-expanding +0.046 histogram, both lines above zero.
- OBV above its MA20 on both timeframes (+10.7% on 90d) and making highs with price — volume flow confirms the advance.
- Price trades above both aVWAP anchors, $6.26 (Jun 26) and $5.79 (Feb 26), leaving little trapped overhead supply.
Bear Case
- The August push to new highs ran mostly at or below the 2,852,735-share 20-day average — an unconfirmed breakout until volume expands.
- ADX 20.8/21.1 is "emerging", still under the 25 line that would mark an established trend.
- Close is pinned near the upper Bollinger band $7.10 with band width already at 16.79% — mean reversion to the $6.55 midline is a normal 6% event.
- RSI 65.1 offers no oversold reset; entries here are paying up for visible strength.
- ATR 3.47% of price means the objective $6.49 stop is 6.9% away — the risk unit is large relative to the recent advance.
- Mansfield RS is −1.03 points versus a month ago and far below its spring peak near +75, with a "flat" slope tag — leadership has not been fully reclaimed.
Scenarios
| Scenario | Probability | Path | Trigger / Invalidation |
|---|---|---|---|
| Breakout continuation | 45% | Holds the SMA5 $6.95 and the 23.6% retracement $6.81, then clears the $7.02 swing high and the $7.20 52-week high, opening the area above the upper band. | Trigger ▲ daily close above $7.20 on volume above the 2.85M average · Invalidation ▼ close back under $6.68 (38.2%). |
| Range digestion | 35% | Rejected at $7.02–$7.20, drifts back into the $6.58–$6.55 zone where the 50% retracement, the SMA20 and the band midline overlap, while ADX stays under 25. | Trigger ▼ upper-wick rejection near $7.20 with RSI slipping under 55 · Invalidation ▲ decisive close above $7.20. |
| Trend failure | 20% | Loses the SMA20 $6.55 and the 2×ATR line $6.49, with the next references at $6.13 (Aug 5 swing low) and the SMA60 $6.05. | Trigger ▼ daily close below $6.49 on above-average volume · Invalidation ▲ reclaim and hold of $6.68. |
Key Levels
| Price | Role | Basis |
|---|---|---|
| $7.20 | Resistance | 52-week high, tagged intraday on Aug 21 |
| $7.10 | Resistance | Upper Bollinger band (20,2) |
| $7.02 | Resistance | Aug 19 swing high · 0% of the current up-swing |
| $6.97 | Current | Aug 21, 2026 close · SMA5 $6.95 immediately below |
| $6.81 | Support | 23.6% retracement of the Aug 5 → Aug 19 swing |
| $6.58 | Support | 50% retracement, overlapping SMA20 $6.55 and the band midline |
| $6.49 | Stop (2×ATR) | Objective invalidation, 6.9% below the close |
What to Watch
- Volume on any break of $7.02–$7.20. A new high that prints below the 2,852,735-share average keeps the breakout unconfirmed.
- The SMA5 at $6.95. Price has been walking on it; losing it and closing under the $6.81 retracement would be the first structural crack.
- MACD histogram, currently +0.046. Contraction toward zero while price holds near the highs would signal momentum leaking out of the leg.
- ADX crossing 25. That would upgrade the move from "emerging" to an established trend; a slide back under 20 says chop.
- OBV versus its MA20. A drop below the average while price stays near $7.00 would be a bearish non-confirmation worth acting on before price catches up.
Conclusion
Past Analyses of This Stock same ticker · newest first
Other signals from this issue same publication date · 6 stocks
This analysis is an educational interpretation of chart data and is not investment advice. Probabilities and levels are subjective estimates; every investment decision, and its outcome, is your own responsibility. Chart readings describe what the data shows as of the close on August 21, 2026, and market conditions can change without notice.
Two Week Swing · twoweekswing.com · 4,600+ stocks screened weekly