Artivion, Inc.
$28.08 −41.8% from the 52-week high · +46.6% from the 52-week low
This analysis is based on closing-price data as of August 21, 2026. Whether you're researching how to buy Artivion, Inc. stock or you've just opened a brokerage account and are trying to time an entry, here are objective support levels and stop-loss references built from the RSI, MACD and ATR indicators.
AORT spent the first half of 2026 unwinding a large 2025 advance: after topping at the $48.25 52-week high late in 2025 the chart slid through the spring, gapped down on May 8 from $34.84 to $27.31, and kept falling into a June low of $19.16. Since mid-July the stock has climbed back in a series of higher lows, and the $28.08 close now sits above SMA20 $27.62 and well above SMA60 $24.30 — a genuine recovery leg, up 46.6% from the low, that has just pushed its nose back into the bottom of the unfilled May gap. What keeps this a repair job rather than a breakout is the company it keeps: Mansfield RS is still −30.26% against the S&P 500, the last week of the advance came on 0.65× average volume, and RSI has printed a bearish divergence into the August 14 high. The lens below is recovery momentum versus the overhead supply the May collapse left behind.
Snapshot values as of the August 21, 2026 close
| Metric | Value | Read |
|---|---|---|
| Close | $28.08 | −41.8% from the 52-week high, +46.6% from the low |
| 52-week high / low | $48.25 / $19.16 | Full range of the two-year record's last twelve months |
| SMA5 / SMA20 / SMA60 | $28.42 / $27.62 / $24.30 | Close above SMA20 and SMA60, marginally below SMA5 |
| Bollinger (20) | $29.54 / $27.62 / $25.70 · width 13.9% | Price in the upper half of the channel, not at the band |
| aVWAP — 90d (Jun 26, 2026 anchor) | $25.92 | Above — buyers anchored to the recovery are in profit |
| aVWAP — 2y (Aug 8, 2025 anchor) | $33.69 | Below — the 2025 cohort is still underwater |
| RSI(14) | 56.87 | Neutral-to-firm; a bearish divergence is flagged |
| Mansfield RS vs the S&P 500 | −30.26% | Underperform; prev week −29.44, prev month −37.01 |
| MACD(12,26) | 0.9274 / signal 0.9853 / hist −0.0579 | Both lines above zero, but a dead cross printed Aug 20, 2026 |
| ADX(14) | 32.12 | Strong — a trending market, direction read from price |
| ATR(14) | $1.21 (4.33% of price) | A typical session moves more than $1 |
| OBV — 2y / 90d | +9.47% / +274.44% vs MA20 | Accumulation on both timeframes, above MA20 and rising |
| Volume | 484,900 vs 20-day avg 746,480 (0.65×) | Light — the latest session did not confirm |
| Stop references | 1×ATR $26.87 · 2×ATR $25.65 | 2×ATR sits 8.65% below the close |
① Price & Moving Averages
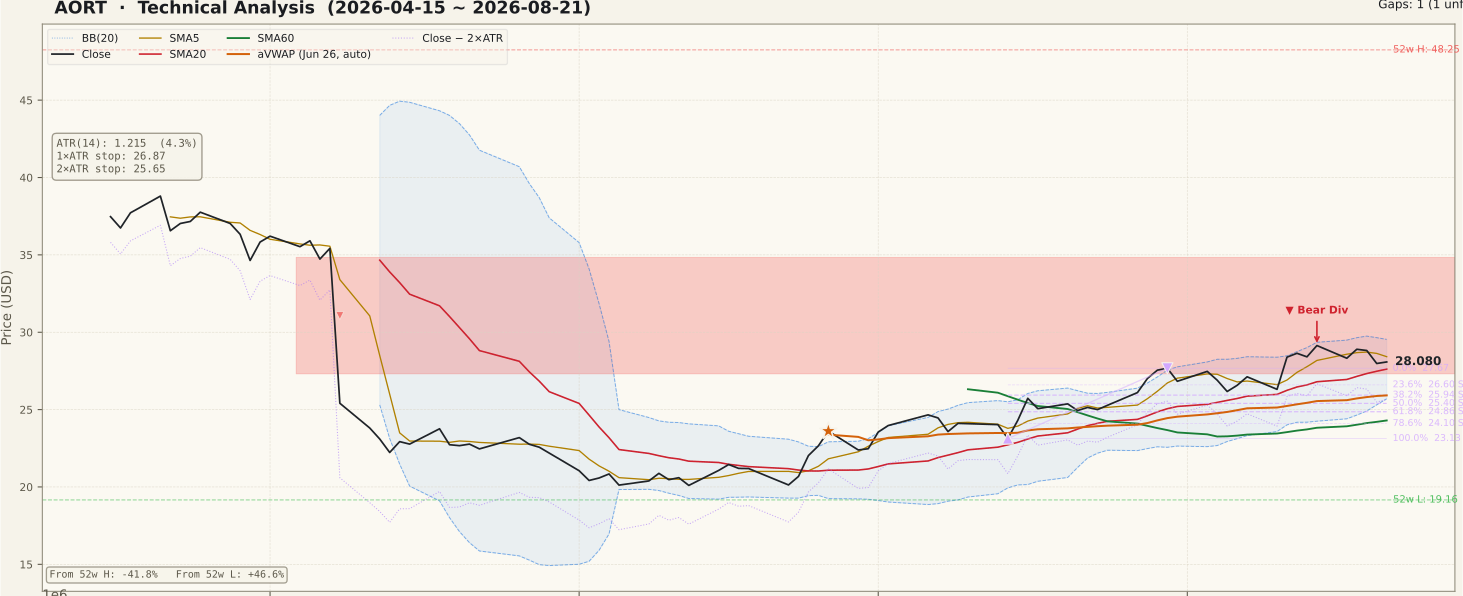
The averages are almost, but not quite, in a bullish stack: close $28.08 > SMA20 $27.62 > SMA60 $24.30, with only SMA5 $28.42 sitting above price after the last two sessions eased back. The 90-day panel shows why that matters — the June trough near the $19.16 52-week low was followed by a stair-step advance in which each pullback held above the rising 20-day line, and the current dip is the shallowest test of that pattern so far. The Bollinger structure is unstretched: width is 13.9% and price sits between the $27.62 midline and the $29.54 upper band rather than walking it, which is the profile of a trend still inside its channel. The two anchored VWAPs disagree by design and both are worth stating: the 90-day anchor from June 26 sits at $25.92 with price above it, so everyone who bought the recovery is in profit, while the two-year anchor from August 8, 2025 sits far overhead at $33.69, a reminder of how much stock changed hands at higher prices. The Fibonacci grid is drawn on the up-swing from the July 14 low of $23.13 to the July 30 high of $27.67, and price has since traded through that anchor high — the marked pullback supports beneath sit at $26.60 (23.6%), $25.94 (38.2%), $25.40 (50%) and $24.86 (61.8%). Above price, the unfilled May 8 gap from $27.31 to $34.84 is the single biggest structural feature on the chart: the close has re-entered its floor but nothing more.
② Volume

The last session traded 484,900 shares against a 20-day average of 746,480 — a ratio of 0.65×, meaning the most recent price action carried about two-thirds of normal participation. On the 90-day panel the two genuine volume events both sit behind us: the enormous bar at the May 8 gap-down and a smaller spike in late June near the turn. The July–August advance itself has been built on ordinary, unremarkable bars. That is the honest weakness in this chart. An advance on average or below-average volume is not invalid, but it is unconfirmed: it tells you sellers have stepped aside, not that buyers have arrived in size. A beginner's trap here is to treat the quiet tape as calm accumulation; the more disciplined reading is that the next attempt at the $29.14 August high needs volume at or above the 746,480 average to mean something different from the last one.
③ MACD

MACD is the clearest illustration of a trend that is intact but cooling. The MACD line reads 0.9274 against a signal of 0.9853, and a dead cross printed on August 20, 2026 — one session before this close. The histogram is −0.0579, barely negative. Context changes what that cross means. Both lines are well above zero, and the 90-day panel shows the golden cross that started this leg happening deep in negative territory near −3.5 in early June, after which the pair climbed steadily for two months. A dead cross that occurs high above the zero line is normally a pause or a loss of acceleration inside an advance, not a trend reversal; a dead cross that then drags both lines back through zero is a different matter. Which of the two this becomes is answered by the histogram over the coming sessions rather than by the cross itself.
④ RSI

RSI(14) is 56.87 — above the 50 line, nowhere near the 70 overbought threshold, and a long way from the sub-30 readings that marked the May and June lows. On its own that is a neutral-to-firm number. The chart flags a regular bearish divergence, and the two peaks are specific: on July 30, 2026 price peaked at $27.67 with RSI at 69.13; on August 14, 2026 price made a higher peak of $29.14 but RSI reached only 66.30. Price made a higher high while momentum made a lower high, which is the textbook pattern. The discipline this deserves is worth stating plainly: a divergence is a warning about the rate of the advance, not a top. It is confirmed only if price then fails at or below the $29.14 peak and breaks the structure underneath it, and it is nullified outright by a close above $29.14 that carries RSI to a new high. Calling a top from the divergence alone, before either of those has happened, is the most common way this signal costs money.
⑤ Mansfield Relative Strength

AORT is NYSE-listed, so Mansfield RS here is measured against the S&P 500, and the reading is −30.26% — deeply below the zero line and tagged as underperforming. The whole 90-day panel is shaded on the negative side; the stock has not been ahead of the index at any point in that window. The direction inside that deficit is more encouraging than the level. A month ago RS stood at −37.01, so the monthly change is +6.76 points — a clear improvement toward zero, consistent with the price recovery. The weekly comparison, however, is −0.81 points from last week's −29.44, so the improvement stalled and gave a little back in the most recent week. Both statements are true and neither cancels the other: the trajectory of the past month is repair, the past week is a pause. The value of stating this precisely is that a deeply negative RS is a real headwind regardless of how good the other panels look. Money has been leaving this name relative to the index for months, and a stock has to spend a long time improving before it stops being a laggard.
⑥ ATR & ADX

ATR(14) is $1.21, or 4.33% of the $28.08 close — an ordinary session covers more than a dollar of range, which is what any position-sizing or stop placement has to absorb. The 90-day panel shows ATR spiking above $2.25 around the May gap and then decaying through the summer to its current level, so volatility has normalised rather than disappeared. ADX(14) reads 32.12, comfortably above the 25 line that separates a trending market from a range. ADX measures strength, never direction — it was equally high during May's decline — so the direction has to come from price, and price is above SMA20 and SMA60. Taken together the panel says the current move up has conviction behind it in the technical sense of persistence. Practically, this ATR is what makes the stop arithmetic honest: a 1×ATR reference is $26.87 and a 2×ATR reference is $25.65, the latter 8.65% below the close. Anything tighter than 1×ATR on a 4.3% daily-range stock is inside the noise.
⑦ OBV

Both timeframes agree here, which is worth noting because they often do not. On the two-year view OBV is 9,704,500 against an MA20 of 8,865,070 — above its average by 9.47%, rising, tagged accumulation. On the 90-day view OBV is 1,145,300 against an MA20 of 305,870, a gap of 274.44%, also rising and also tagged accumulation. The very large 90-day percentage is a reminder to read the tag rather than the number: the short-window OBV average sits close to zero after the May–June flush, so small absolute gains produce enormous percentages. What the panel genuinely shows is that OBV crossed back above its average in early August and has kept making higher highs while price did the same — no bearish non-confirmation on the volume-flow side. This is the strongest bullish element on the page, and it sits in direct tension with the 0.65× session volume and the RSI divergence. OBV says the accumulated flow over the recovery has been positive; the volume panel says the latest push had few participants. Neither reading is wrong, and holding both is more useful than picking one.
Bull vs Bear
Bull Case
- Close $28.08 is above both SMA20 $27.62 and SMA60 $24.30, and 46.6% above the $19.16 52-week low.
- MACD lines are both clearly positive (0.9274 / 0.9853) after a golden cross deep below zero in June — the leg still has structure.
- OBV is tagged accumulation on both timeframes, above MA20 and rising (+9.47% 2y, +274.44% 90d).
- Mansfield RS has improved +6.76 points in a month, from −37.01 to −30.26 — the underperformance is narrowing.
- Price has re-entered the May 8 gap zone at its $27.31 floor, the first reclaim of that level since the collapse.
- ADX 32.12 with price above the rising 20- and 60-day lines describes a trending advance rather than aimless drift.
Bear Case
- Mansfield RS is −30.26% against the S&P 500 and fell 0.81 points week over week — still a laggard, and momentarily getting worse.
- RSI bearish divergence: the August 14 peak of $29.14 exceeded the July 30 peak of $27.67, but RSI fell from 69.13 to 66.30.
- A MACD dead cross printed on August 20, 2026 with the histogram at −0.0579 — acceleration has stopped.
- The latest session traded 0.65× its 20-day average volume (484,900 vs 746,480); the advance is unconfirmed by participation.
- The unfilled May 8 gap from $27.31 to $34.84 is an overhead supply band the stock has only just entered at the bottom.
- Price is 41.8% below the $48.25 52-week high and far under the 2-year aVWAP of $33.69 — years of trapped stock sit above.
Scenarios
| Scenario | Probability | Path | Trigger / Invalidation |
|---|---|---|---|
| Recovery continues | 40% | The dip holds above SMA20 $27.62, price reclaims $29.14 and works up into the May gap toward the $29.54 band and beyond. | Trigger: a close above $29.14 with volume at or above 746,480. Invalidation: a close back below $27.31. |
| Sideways digestion | 35% | Price oscillates between the $27.31–$27.67 cluster and the $29.14 August high while the MACD dead cross resolves and RS grinds. | Trigger: histogram hovering near zero with price holding the 20-day line. Invalidation: a decisive break of either boundary. |
| Divergence confirms | 25% | The bearish divergence resolves lower: SMA20 fails, price loses the gap floor and works toward the $25.94–$25.40 Fibonacci zone. | Trigger: a close below $27.31 on rising volume. Invalidation: price recovering above $28.42 (SMA5). |
Key Levels
| Price | Role | Basis |
|---|---|---|
| $29.54 | Resistance | Upper Bollinger band (20) |
| $29.14 | Resistance | August 14, 2026 high — the second peak of the RSI bearish divergence |
| $28.42 | Resistance | SMA5 — price slipped just beneath it in the last two sessions |
| $28.08 | Current close | August 21, 2026 close |
| $27.62 | Support | SMA20 and Bollinger midline — the line every pullback in this leg has held |
| $27.31 | Support | Floor of the unfilled May 8, 2026 gap ($27.31–$34.84) |
| $25.65 | 2×ATR stop | Objective invalidation — 8.65% below the close, based on ATR(14) $1.21 |
What to Watch
- The $29.14 retest and its volume. A close above the August 14 high on 746,480 shares or more would neutralise the bearish divergence; the same close on 0.65× volume would not.
- The MACD histogram. Currently −0.0579. Back above zero within a few sessions means the August 20 dead cross was a pause; a widening negative histogram that drags both lines toward zero is the confirmation the bears need.
- The $27.31–$27.67 cluster. SMA20 $27.62, the July 30 swing anchor $27.67 and the May gap floor $27.31 sit within 1.3% of each other. Holding that band on a closing basis keeps the recovery structure intact.
- Mansfield RS week to week. The month has improved +6.76 points but the last week gave back 0.81. A second consecutive negative weekly change would say the relative repair has stopped, whatever price is doing.
- OBV versus its MA20. Accumulation on both timeframes is the strongest bullish element here; an OBV close back beneath its average would remove it and leave the divergence unopposed.
Conclusion
Past Analyses of This Stock same ticker · newest first
Other signals from this issue same publication date · 6 stocks
This analysis is an educational interpretation of chart data and is not investment advice. Probabilities and levels are subjective estimates; every investment decision, and its outcome, is your own responsibility. All figures are derived from closing-price data through August 21, 2026.
Two Week Swing · twoweekswing.com · 4,600+ stocks screened weekly