EuroDry Ltd.
$67.12 −6.6% from the 52-week high · +532.1% from the 52-week low
This analysis is based on closing-price data as of September 11, 2026. Whether you're researching how to buy EuroDry Ltd. stock or you've just opened a brokerage account and are trying to time an entry, here are objective support levels and stop-loss references built from the RSI, MACD and ATR indicators.
On the two-year chart EDRY spent most of 2025 and early 2026 in a low, flat base near the $10–$25 area before a sustained advance carried the close to $67.12 — within $4.72 of the $71.84 52-week high and up 532.1% from the $10.62 low. Every trend gauge in the sidecar is aligned with that move: SMA5 > SMA20 > SMA60, MACD above its signal line since the golden cross, ADX at 75.0, and Mansfield RS at +205.59% and still rising against the Nasdaq Composite. The counterweight is stretch rather than weakness — RSI 78.9 with a flagged regular bearish divergence, a close above the upper Bollinger band, and Bollinger width at 62.32%. Read this page as a study of a mature, extended uptrend: the direction is not in dispute, the distance from any structural support is.
Snapshot values as of September 11, 2026 close
| Close | $67.12 |
|---|---|
| 52-week high / low | $71.84 / $10.62 (−6.6% / +532.1%) |
| SMA 5 / 20 / 60 | $61.21 / $51.03 / $33.86 bullish alignment |
| Bollinger upper / mid / lower | $66.93 / $51.03 / $35.13 (width 62.32%) |
| aVWAP — 90d | $38.14 (anchor Jun 15, 2026) |
| aVWAP — 2y | $32.45 (anchor Sep 18, 2025) |
| RSI (14) | 78.93 overbought · bearish divergence flagged |
| Mansfield RS vs the Nasdaq Composite | +205.59% outperform, rising (prev week 145.40 · prev month 100.44) |
| MACD / signal / histogram | 7.685 / 6.739 / +0.946 (golden cross Jul 14, 2026) |
| ADX (14) | 75.01 strong trend |
| ATR (14) | $4.68 (6.98% of price) |
| OBV — 2y / 90d | Accumulation, above MA20, rising (both) · spread vs OBV MA20: 28.42% / 29.31% |
| Volume — last / 20d avg | 220,600 / 152,460 shares (1.45×) |
| Stop reference — 1× / 2× ATR | $62.44 / $57.75 |
① Price & Moving Averages
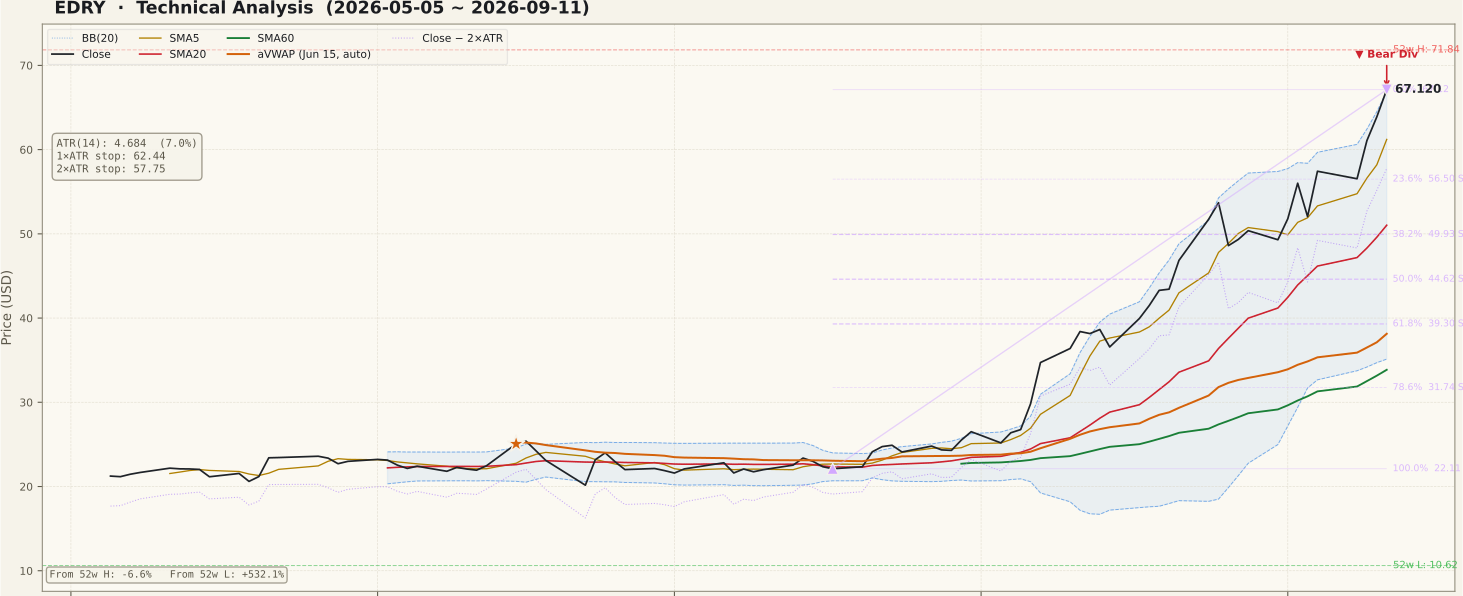
The moving-average stack is in textbook bullish order: close $67.12 above SMA5 $61.21, above SMA20 $51.03, above SMA60 $33.86. What the arrangement also shows is how far the price has travelled from its own mean — the gap between the close and SMA20 is roughly a third of the SMA20 value itself, and the close sits above the upper Bollinger band at $66.93 with band width at 62.32%, an unusually wide reading that reflects expansion rather than compression. Riding the upper band is a hallmark of a strong trend, but it is not a level you can lean on: the first structural reference below is SMA5, then the 23.6% Fibonacci retracement at $56.50 and SMA20 / Bollinger mid at $51.03.
The Fibonacci grid is anchored to an up-swing from $22.11 (Jul 17, 2026) to $67.12 (Sep 11, 2026), so the plotted levels are pullback supports: 23.6% at $56.50, 38.2% at $49.93, 50% at $44.62, 61.8% at $39.30. The 0% level at $67.12 marks the end of the swing and now acts as the nearest resistance reference, with the 52-week high at $71.84 above it. Both anchored VWAPs sit far below — 90-day $38.14, two-year $32.45 — which means the average buyer over either horizon is comfortably in profit, a condition that reduces overhead supply but also leaves a wide air pocket beneath the price. The 90-day window records no unfilled gaps; the three unfilled support gaps on the two-year chart ($14.50–$14.19, $11.15–$10.62, $9.01–$8.40) are too distant to function as near-term references.
② Volume

The final session traded 220,600 shares against a 20-day average of 152,460 — a ratio of 1.45×. That is participation above normal, which is the confirmation you want to see alongside a new high, but it is a long way from the kind of three-to-five-times surge that marks a news event. The pattern through the advance has been steady rather than explosive: the 20-day average itself has drifted higher as the trend matured, so the current tape is expanding the base of participation instead of spiking on a single session.
The number that most deserves a beginner's attention here is the absolute one. A 20-day average of about 152,000 shares is a thin book. In a name that trades this lightly, ordinary order flow can move the price several percent in a session without producing any unusual volume signature at all — which is exactly what the recent tape shows. Two practical consequences follow: volume confirmation is a weaker signal here than it would be in a heavily traded stock, and the bid-ask spread plus slippage on a market order can consume a meaningful slice of a short-horizon move. Position sizing matters more than usual in low-liquidity names.
③ MACD

MACD reads 7.685 against a signal line of 6.739, leaving the histogram positive at +0.946. The most recent cross recorded on the 90-day sidecar is a golden cross dated July 14, 2026; the two-year file dates the same regime change to July 21, 2026, a difference that comes from the two lookback windows rather than from a disagreement about direction. Either way, momentum has been positive and uninterrupted for roughly two months.
Two cautions belong with that reading. First, MACD is an unbounded oscillator, and a value near 7.7 is very far above the zero line — this is a late-trend reading, not the early post-cross condition that offers the best reward-to-risk. Second, the histogram is what turns first: a contraction toward zero while price still makes highs would be the earliest mechanical hint that the advance is losing thrust. Right now no such contraction is confirmed, and a positive histogram with a widening MACD-signal gap remains a bullish condition on its own terms.
④ RSI

RSI stands at 78.93, well inside overbought territory, and the sidecar flags a regular bearish divergence. The two marked peaks are July 31, 2026 — price $26.51, RSI 80.70 — and September 11, 2026 — price $67.12, RSI 78.93. Price made a much higher high while RSI made a marginally lower high, which satisfies the definition.
It is worth being precise about how strong that signal actually is. The RSI difference between the two peaks is under two points, while the price difference between them is more than 150% — a very shallow divergence spread across a very large advance. Divergences of this shape are common inside powerful trends and are frequently resolved by continuation rather than reversal; RSI can simply stay pinned above 70 for weeks while price keeps rising. The honest reading is that this is a caution flag, not a top call. A divergence becomes actionable only when price confirms it — here, that would mean losing SMA5 at $61.21 and then failing to reclaim it. Treating an overbought RSI as a sell signal in isolation is one of the more expensive beginner errors, and treating a divergence as a confirmed top is the same mistake wearing a different hat.
⑤ Mansfield Relative Strength

Measured against the Nasdaq Composite, Mansfield RS reads +205.59% with a rising slope — deep in outperformance territory. The prior readings give the trajectory: one week ago 145.40, one month ago 100.44, which works out to a weekly change of +60.19 and a monthly change of +105.15. RS is positive and accelerating, the strongest of the four quadrants, and because the Mansfield calculation is anchor-free the 90-day and two-year panels agree exactly.
This is the single most supportive element on the page. An advance that outpaces its benchmark by this margin, and is still widening the gap, is not a drift higher on a rising market — it is genuine relative demand. The caveat is symmetrical: RS readings this extreme are, by construction, built on a price move that has already happened, and the same leverage that produced the outperformance works in reverse when the leadership rotates. A flattening RS slope while price holds up would be an earlier warning than anything the price panel gives.
⑥ ATR & ADX

ADX is 75.01, classified as a strong trend and far above the conventional 25 threshold. ADX measures the strength of a directional move, not its direction, and in combination with the bullish moving-average stack it confirms that the advance has been persistent rather than choppy. Readings this elevated are rare and are usually late-cycle: they describe a trend that has already run, and they historically resolve through consolidation that lets the indicator cool rather than through further acceleration.
ATR sits at $4.68, or 6.98% of the current price — a high volatility reading that has practical consequences for anyone sizing a position. A 1× ATR reference is $62.44 and 2× ATR is $57.75, which is about 14% below the close. That is the objective invalidation distance the chart is asking for; a tighter stop is not a smaller risk, it is a higher probability of being taken out by normal daily noise. If a $57.75 invalidation is uncomfortable, the correct adjustment is a smaller position, not a closer stop.
⑦ On-Balance Volume

Both timeframes report the same OBV state: accumulation, above the OBV 20-day moving average, slope rising. On the 90-day file OBV is 3,154,300 against an OBV MA20 of 2,439,305; on the two-year file, 3,230,900 against 2,515,905. The spread between OBV and its own moving average is 29.31% and 28.42% respectively — a measure of accumulation intensity, not a divergence reading.
No OBV divergence is flagged on either timeframe, so the volume-weighted line is confirming the price advance rather than lagging it. That matters because it separates this setup from the classic warning pattern where price prints a new high while OBV rolls over. The caveat carried over from the volume panel applies here too: OBV is built from daily volume, and in a name averaging around 152,000 shares a day, a handful of larger-than-usual orders can shift the line more than the underlying conviction warrants. Use it as corroboration, not as a standalone verdict.
Bull vs Bear
Bull Case
- Full bullish alignment — close $67.12 > SMA5 $61.21 > SMA20 $51.03 > SMA60 $33.86.
- ADX 75.01 confirms a strong, persistent directional trend rather than a choppy drift.
- Mansfield RS +205.59% vs the Nasdaq Composite and accelerating (+60.19 week, +105.15 month).
- MACD 7.685 above signal 6.739 with a positive histogram (+0.946); no dead cross since July.
- OBV in accumulation on both timeframes, above its MA20 and rising, with no divergence flagged.
- Price above both anchored VWAPs ($38.14 90-day, $32.45 two-year) — the average holder is in profit, so overhead supply is light.
Bear Case
- RSI 78.93 is deeply overbought and a regular bearish divergence is flagged (Jul 31 RSI 80.70 vs Sep 11 RSI 78.93).
- Close is far extended above SMA20 ($67.12 vs $51.03) — mean reversion alone could cost a large percentage.
- Close is above the upper Bollinger band ($66.93) with band width at 62.32%; expansion this wide rarely persists.
- ATR is 6.98% of price, so the objective 2× ATR invalidation at $57.75 sits about 14% below the close.
- Nearest Fibonacci support is 23.6% at $56.50 and the next is 38.2% at $49.93 — a normal retracement is a very large dollar move.
- 20-day average volume of 152,460 shares is thin; volume confirmation is less reliable and slippage risk is real.
Scenarios
| Scenario | Probability | Path | Trigger / Invalidation |
|---|---|---|---|
| Trend continuation | 45% | Price continues to ride the upper Bollinger band, holds SMA5 $61.21 on any pause, and challenges the 52-week high at $71.84. | Trigger: daily closes held above $66.93 with volume at or above the 1.45× recent pace. Invalidation: a close below $61.21 followed by a failure to reclaim it. |
| Overbought consolidation | 40% | RSI unwinds from 78.93 while price digests between the 23.6% retracement at $56.50 and the recent high, with SMA20 $51.03 rising into the range. | Trigger: loss of SMA5 $61.21 and a MACD histogram contraction toward zero. Invalidation: a decisive close back above $66.93. |
| Deeper retracement | 15% | The divergence resolves lower; price works back through $56.50 toward the 38.2%–50% Fibonacci zone at $49.93–$44.62, where SMA20 and the Bollinger mid sit. | Trigger: a close below the 2× ATR reference $57.75. Invalidation: recovery and hold above $61.21. |
Key Levels
| Price | Role | Basis |
|---|---|---|
| $71.84 | Resistance | 52-week high |
| $67.12 | Current close | Sep 11, 2026 close · 0% of the up-swing (swing end / anchor high) |
| $66.93 | Reference | Upper Bollinger band — price is currently above it |
| $61.21 | Support | SMA5 — first dynamic reference under the price |
| $57.75 | Stop reference (2× ATR) | Objective invalidation, about 14% below the close |
| $56.50 | Support | 23.6% Fibonacci retracement of the $22.11 → $67.12 up-swing |
| $51.03 | Support | SMA20 and Bollinger mid-band |
What to Watch
- SMA5 at $61.21. It is the first mechanical test of whether the advance is pausing or turning; a close below it that is not reclaimed is the earliest confirmation the RSI divergence deserves attention.
- The MACD histogram. Currently +0.946. A contraction toward zero while price still makes highs would be the first internal sign that thrust is fading.
- Volume against the 152,460-share 20-day average. Continuation on shrinking volume, or a sharp down session on a multiple of the average, both change the character of the tape.
- The Mansfield RS slope. Flattening from +205.59% while price holds would signal that leadership is rotating away before the price chart shows it.
- The $71.84 52-week high. How price behaves on the first approach — acceptance above, or rejection back inside the band — frames the next several weeks.
Conclusion
Past Analyses of This Stock same ticker · newest first
Other signals from this issue same publication date · 5 stocks
This analysis is an educational interpretation of chart data and is not investment advice. Probabilities and levels are subjective estimates; every investment decision, and its outcome, is your own responsibility. Low-volume stocks carry additional spread and slippage risk.
Two Week Swing · twoweekswing.com · 4,600+ stocks screened weekly