Ziff Davis, Inc.
$53.87 −7.2% from the 52-week high · +140.0% from the 52-week low
This analysis is based on closing-price data as of August 7, 2026. Whether you're researching how to buy Ziff Davis, Inc. stock or you've just opened a brokerage account and are trying to time an entry, here are objective support levels and stop-loss references built from the RSI, MACD and ATR indicators.
The two-year chart splits cleanly in two: a long 2024–2025 decline that carried price from the high $50s down to a $22.45 low, and then a single explosive session on March 3, 2026 that left an unfilled gap between $28.02 and $41.11 and reset the entire structure. Since that gap the stock has trended higher in orderly fashion — Mansfield RS flipped from roughly −30 to +19.28% against the Nasdaq Composite, and the close of $53.87 now sits just 7.2% below the $58.06 52-week high with the moving averages in full bullish order. The short-term picture is a pullback inside that advance: price was turned back at $55.38 on August 4, dropped to $50.95 on August 6, and rebounded to $53.87 on 2.49× average volume, all while a bearish RSI divergence and a July 21 MACD dead cross sit on the tape. The working lens is therefore a high-momentum trend digesting its first real setback, with the objective invalidation at the 2×ATR reference of $49.22.
Snapshot all values as of the August 7, 2026 close
| Close | $53.87 · −7.2% from 52w high, +140.0% from 52w low |
|---|---|
| 52-week high / low | $58.06 / $22.45 |
| SMA 5 / 20 / 60 | $53.39 / $52.91 / $48.77 — close above all three (bullish order) |
| Bollinger (20) | Upper $55.18 · Mid $52.91 · Lower $50.63 · width 8.60% |
| aVWAP — 2y | $45.73 (anchored Mar 3, 2026) — price well above |
| aVWAP — 90d | $51.46 (anchored Jun 18, 2026) — price above |
| RSI (14) | 55.69 (90d) / 55.70 (2y) — bearish divergence flagged |
| Mansfield RS vs the Nasdaq Composite | +19.28% — outperform, slope falling (prev week +24.47, prev month +20.48) |
| MACD (12,26,9) | MACD 0.81 · Signal 1.04 · Histogram −0.23 — dead cross on Jul 21, 2026 |
| ADX (14) | 28.27 (90d) / 27.97 (2y) — strong trend |
| ATR (14) | $2.33 — 4.32% of price |
| OBV | 2y: early accumulation (above MA20, flat, +34.11%) · 90d: accumulation (above MA20, rising, +21.53%) |
| Volume | 1,472,400 vs 20-day average 592,135 — 2.49× average |
| Unfilled gap | $28.02 → $41.11 (Mar 3, 2026) — support, far below price |
| Stop references | 1×ATR $51.54 · 2×ATR $49.22 |
① Price & Moving Averages
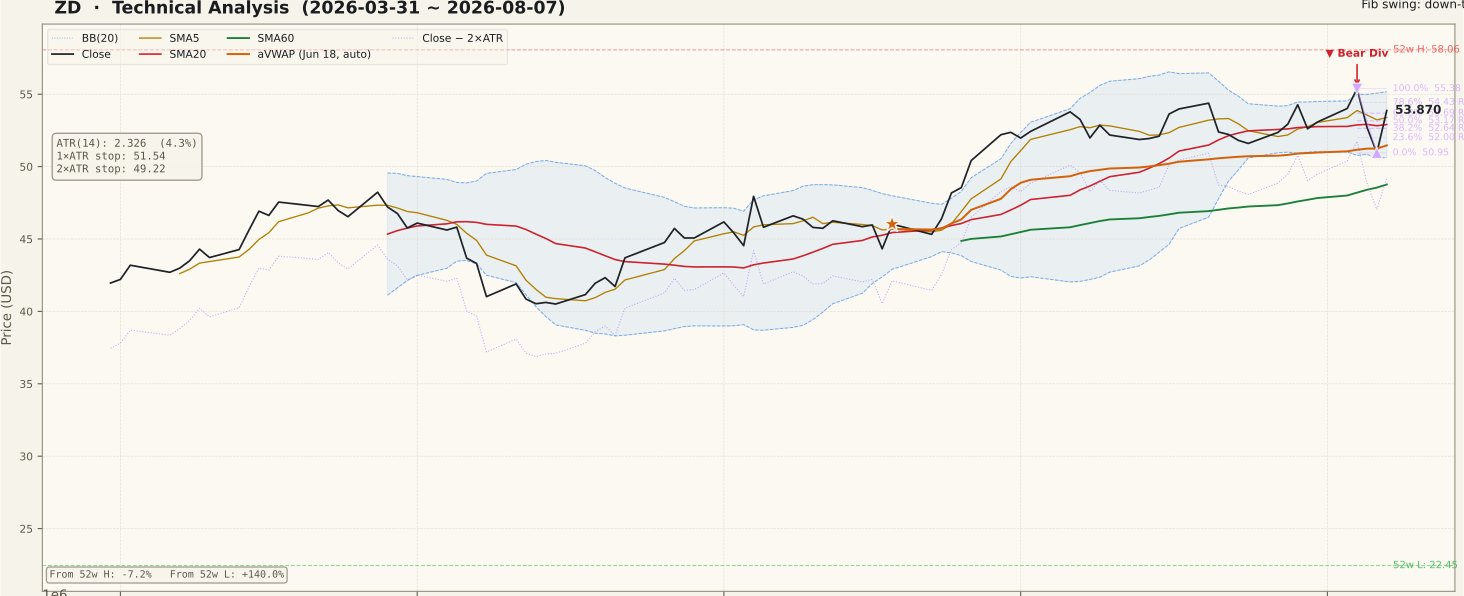
The moving-average stack is in textbook bullish order and price sits on top of it: close $53.87 above SMA5 $53.39, above SMA20 $52.91, above SMA60 $48.77, with all three lines rising on the 90-day panel. The recent action is a two-session air pocket rather than a structural break — price was rejected at $55.38 on August 4, fell to $50.95 on August 6 (just above the Bollinger lower band at $50.63), and closed back at $53.87, recovering more than the 61.8% retracement of that drop at $53.69. Overhead, the 78.6% level at $54.43 and the Bollinger upper band at $55.18 stand between price and the August 4 swing high; above that, the $58.06 52-week high is the open reference. Bollinger width of 8.60% is comparatively narrow for a name whose ATR is 4.32% of price, so the bands are more likely to expand than contract from here. Both anchored VWAPs sit below — $45.73 from the March 3 gap and $51.46 from the June 18 anchor — meaning the average buyer from either anchor is still in profit, though the 90-day anchor is only $2.41 below the close and is the first level that would put recent buyers underwater.
② Volume

The final session traded 1,472,400 shares against a 20-day average of 592,135 — 2.49× normal, and the largest single bar of the entire 90-day window. It came on the rebound off $50.95, which is the constructive version of a volume spike: participation expanding into a recovery rather than into breakdown. Two cautions belong next to that. First, one bar is one bar; the pattern only means something if follow-through volume stays above average as price works back toward $55.38. Second, an isolated 2.5× session in a stock that averages under 600,000 shares often marks an event rather than a trend, and the chart alone cannot say which. On the two-year panel the reference point is the March 3, 2026 bar, where volume ran roughly seventeen times the prevailing average — the single most important volume event in the record and the origin of the current advance.
③ MACD

MACD printed a dead cross on July 21, 2026 and remains below its signal line, with MACD at 0.81, signal at 1.04 and the histogram at −0.23. The important context is location: both lines are still well above the zero line, so this is a momentum cross inside an uptrend rather than a trend reversal signature. What is less comfortable is duration — the cross is now more than two weeks old and the histogram has stayed negative throughout, meaning the fast average has been decaying toward the slow one rather than snapping back. On the 90-day panel MACD has rolled over from a peak near 2.15 in early July, so momentum has been fading for a month even as price held near its highs. A histogram that curls back toward zero over the coming sessions would confirm the pullback reading; MACD sliding into negative territory would mark the first genuine loss of trend energy since March.
④ RSI

RSI(14) reads 55.69 on the 90-day frame (55.70 on two years) — neutral, and comfortably above the 50 line that separates the two momentum regimes. The generator flags a regular bearish divergence: the first peak on July 6, 2026 paired a price of $53.78 with RSI 73.73, while the second peak on August 4, 2026 printed a higher price of $55.38 on a materially lower RSI of 65.11. Higher high in price, lower high in momentum — the textbook shape, and a gap of more than eight RSI points is not a marginal reading. The discipline is to treat it as a warning about the rate of buying pressure, not as a confirmed top: strong trends routinely print a divergence, rest and continue, and this one has already been partly worked off by the drop to $50.95. The reference that matters over the next two weeks is 50 — RSI holding above it through the pullback keeps the momentum profile intact, while a decisive break below would mean the divergence is resolving downward.
⑤ Mansfield RS vs the Nasdaq Composite

Mansfield RS stands at +19.28% against the Nasdaq Composite — clearly in outperform territory, and the two-year panel shows how unusual that is for this name: the line spent essentially all of 2024–2025 between −20 and −40 and only crossed above zero after the March 2026 gap. The direction, however, has turned. Against last week's +24.47 the reading is down −5.19 points, and against last month's +20.48 it is down −1.20 points — positive but slowing on both horizons, which is the honest label rather than "improving". The distinction matters because a stock can keep beating its index for months while the margin narrows; what would change the picture is a slide back toward zero, since fading relative strength is usually the earliest warning and typically arrives before price structure breaks. For now the buffer is wide: RS would have to give back nearly twenty points to reach the zero line it crossed in March.
⑥ ATR & ADX

ADX(14) at 28.27 on the 90-day frame (27.97 on two years) is above the 25 threshold, so the market is reading this as a genuine directional trend rather than chop. ADX measures strength and not direction, so it neither confirms nor denies the up-side bias — it simply says the moves have been persistent. ATR(14) is $2.33, or 4.32% of price, and the 90-day panel shows the sharpest feature on the page: ATR jumped almost vertically in the final two sessions after spending the quarter between roughly $1.70 and $1.95. That is range expansion, and it changes the arithmetic of any stop placement — a 1×ATR reference sits at $51.54 and a 2×ATR reference at $49.22, roughly 8.6% below the close. In a stock now moving more than 4% in an average day, anything tighter than that is likely to be triggered by ordinary noise rather than by a real change in the chart.
⑦ OBV

Both timeframes agree here, which is the strongest single piece of evidence on the page. On the 90-day frame OBV is tagged accumulation — above its 20-day average by +21.53% with a rising slope, at an absolute value of roughly 7.66 million after climbing steadily since late June. On the two-year frame the tag is early accumulation: above MA20 by +34.11%, but with a flat slope, and the absolute level of about 5.34 million has only recently recovered from deeply negative territory. Read together, volume has been flowing in behind the advance rather than leaking out of it, and the recent price setback did not break that. The caveat is the flat two-year slope: on the longer frame accumulation has stalled rather than accelerated, so a fresh OBV high alongside a move back over $55.38 would be genuine confirmation, while OBV rolling under its MA20 while price holds up would be the non-confirmation to respect.
Bull Case vs Bear Case
Bull Case
- Full bullish moving-average order, all rising: close $53.87 > SMA5 $53.39 > SMA20 $52.91 > SMA60 $48.77.
- Mansfield RS +19.28% vs the Nasdaq Composite — outperform, after two years spent almost entirely below zero.
- Both OBV frames sit above their MA20 (90d +21.53% rising, 2y +34.11%) — volume has followed the advance.
- Price is above both anchored VWAPs, $45.73 (2-year) and $51.46 (90-day).
- ADX 28.27 confirms a strong directional trend rather than random drift.
- The rebound off $50.95 recovered past the 61.8% retracement at $53.69 on 2.49× average volume.
Bear Case
- Regular bearish RSI divergence: price $53.78 → $55.38 while RSI fell 73.73 → 65.11 (Jul 6 → Aug 4).
- MACD dead cross on Jul 21 with the histogram still negative at −0.23 more than two weeks later.
- Mansfield RS slope is falling — down −5.19 points on the week and −1.20 on the month.
- Price was rejected at $55.38 and remains 7.2% below the $58.06 52-week high.
- ATR expanded to 4.32% of price in two sessions, so the 2×ATR reference is a wide 8.6% away.
- The whole structure rests on the March 3, 2026 gap ($28.02 → $41.11), an event the chart cannot explain.
Scenarios
| Scenario | Probability | Path | Trigger / Invalidation |
|---|---|---|---|
| Pullback completes, trend resumes | 45% | Price holds the SMA20 and Bollinger midline at $52.91, clears the 78.6% level at $54.43 and the Bollinger upper band at $55.18, then reclaims the August 4 high at $55.38 with the 52-week high at $58.06 as the next reference. | Trigger: daily close above $55.38 on above-average volume with the MACD histogram back at or above zero. Invalidation: daily close below $52.91. |
| Range between $50.95 and $55.38 | 35% | The bearish divergence and the stale MACD cross keep a lid on price while the rising SMA20 catches up from below; the stock oscillates between the August 6 low and the August 4 high, with the 50% level at $53.17 as the pivot, until one edge gives way. | Trigger: repeated failures near $54.43–$55.18 without a close below $50.95. Invalidation: a decisive daily close outside either edge of the range. |
| Divergence resolves lower | 20% | The 90-day anchored VWAP at $51.46 gives way, price loses the August 6 low at $50.95 and the Bollinger lower band at $50.63, RSI breaks 50, and the decline extends toward the SMA60 at $48.77, which sits just below the 2×ATR reference. | Trigger: sustained trade below $50.95 with volume above average. Invalidation: RSI holding above 50 while price defends the $52.91 SMA20. |
Key Levels
| Price | Role | Basis |
|---|---|---|
| $58.06 | Resistance | 52-week high — 7.2% above the close |
| $55.38 | Resistance | August 4, 2026 swing high; 100% anchor of the current down-swing, with the Bollinger upper band at $55.18 just beneath |
| $54.43 | Resistance | Fibonacci 78.6% retracement of the $55.38 → $50.95 drop — the first level overhead |
| $53.87 | Current | Close of August 7, 2026 |
| $52.91 | Support | SMA20 and Bollinger midline; SMA5 $53.39 and the 61.8% level $53.69 sit between this and the close |
| $50.95 | Support | August 6, 2026 low and 0% anchor of the down-swing; Bollinger lower band $50.63 immediately below |
| $49.22 | 2×ATR stop | Objective invalidation — 8.6% below the close, just above the SMA60 at $48.77 |
What to Watch
- The August 4 high at $55.38. A close above it with volume above the 592,135-share average would say the pullback is over; repeated rejections there while the divergence stands would say the opposite.
- The SMA20 at $52.91. It is both the moving average and the Bollinger midline, and the rising 20-day line has been the floor of this advance since June. A close beneath it moves the burden of proof to $50.95.
- MACD histogram depth. Negative since July 21 at −0.23; a curl back toward zero supports continuation, while MACD sliding under zero would be the first real break in trend energy since March.
- Mansfield RS direction. Still +19.28%, but −5.19 on the week. A continued slide toward zero would matter more than any single price bar.
- The catalyst behind the volume. The final session traded 2.49× average volume and ATR expanded by roughly a third in two days; the March 3 gap from $28.02 to $41.11 is an even larger unexplained event. Both are company-specific news signatures that the chart records but cannot identify.
Conclusion
Past Analyses of This Stock same ticker · newest first
Other signals from this issue same publication date · 5 stocks
This analysis is an educational interpretation of chart data and is not investment advice. Probabilities and levels are subjective estimates; every investment decision, and its outcome, is your own responsibility. This stock's chart is dominated by an unexplained one-day gap, so technical signals alone are not a basis for action. Chart data reflects closing prices through August 7, 2026 and does not account for events after that date.
Two Week Swing · twoweekswing.com · 4,600+ stocks screened weekly