Maplebear Inc.
$50.17 −6.2% from the 52-week high · +53.3% from the 52-week low
This analysis is based on closing-price data as of August 7, 2026. Whether you're researching how to buy Maplebear Inc. stock or you've just opened a brokerage account and are trying to time an entry, here are objective support levels and stop-loss references built from the RSI, MACD and ATR indicators.
Maplebear Inc. — the company behind the Instacart brand — spent most of the past year underperforming badly, with Mansfield RS parked between −20 and −30 against the Nasdaq Composite from late 2025 into February 2026, before basing near $32.73 and grinding back up all spring. The final session in this dataset changed the character of that recovery: price closed at $50.17 on 3.5× average volume, above the upper Bollinger band at $49.36, clearing the June–July congestion in a single bar and leaving the stock just 6.2% below the $53.50 52-week high. The bullish reading is a breakout with participation — full moving-average alignment, a MACD golden cross the same day, and Mansfield RS flipping to +6.84%. The cautionary reading is that ADX is still only 14.8 (a range, not a trend), RSI made a lower high than in June, and a one-day 3.5×-volume expansion of this size usually has a catalyst behind it — so the working lens is an unconfirmed breakout, with the objective invalidation at the 2×ATR reference of $46.32.
Snapshot all values as of the August 7, 2026 close
| Close | $50.17 · −6.2% from 52w high, +53.3% from 52w low |
|---|---|
| 52-week high / low | $53.50 / $32.73 |
| SMA 5 / 20 / 60 | $46.32 / $45.68 / $44.03 — close above all three, full bullish order |
| Bollinger (20) | Upper $49.36 · Mid $45.68 · Lower $42.00 · width 16.13% — close above the upper band |
| aVWAP — 2y | $42.25 (anchored Nov 13, 2024) — price well above |
| aVWAP — 90d | $43.77 (anchored May 6, 2026) — price above |
| RSI (14) | 66.90 (90d) / 66.89 (2y) — below 70, bearish divergence flagged |
| Mansfield RS vs the Nasdaq Composite | +6.84% — outperform, rising (prev week −0.68, prev month +2.22) |
| MACD (12,26,9) | MACD 0.37 · Signal 0.11 · Histogram +0.26 — golden cross on Aug 7, 2026 |
| ADX (14) | 15.05 (90d) / 14.76 (2y) — ranging, weak trend strength |
| ATR (14) | $1.93 — 3.84% of price |
| OBV | 2y: early accumulation (above MA20, flat, +3.07%) · 90d: weakening (above MA20, falling, +18.44%) |
| Volume | 14,310,800 vs 20-day average 4,083,105 — 3.51× average |
| Stop references | 1×ATR $48.24 · 2×ATR $46.32 |
① Price & Moving Averages
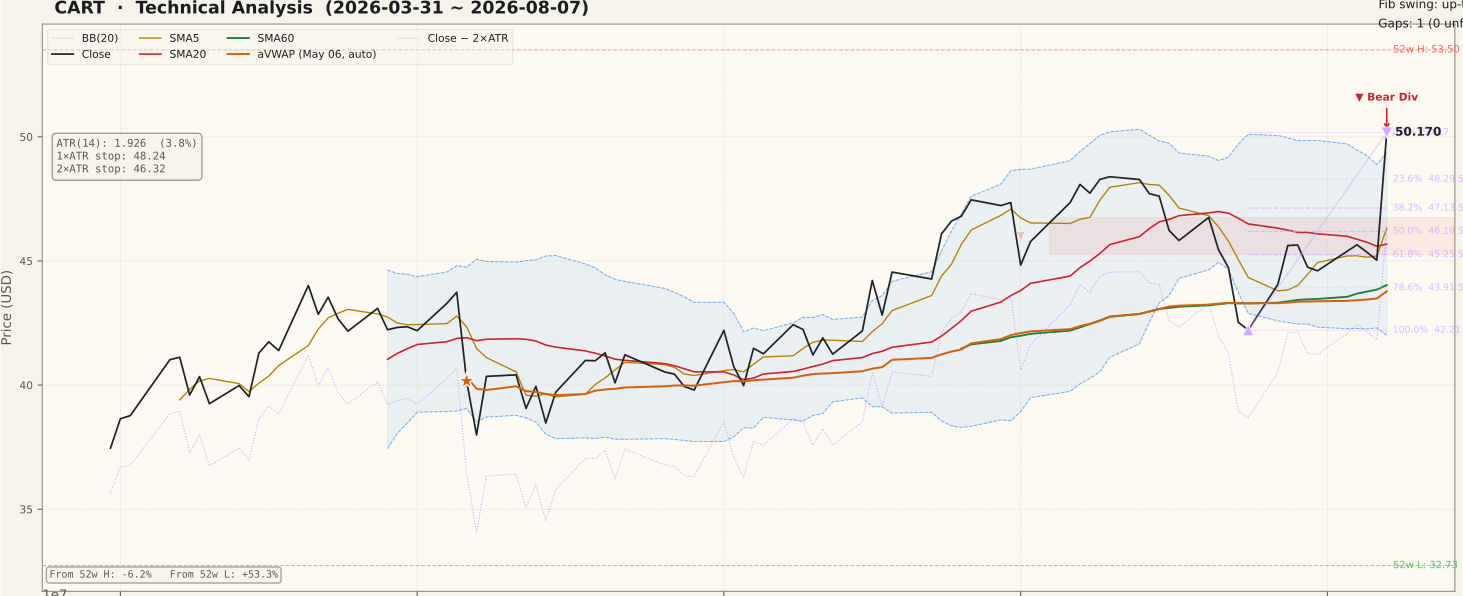
The moving-average stack is in the textbook bullish order — close $50.17 above SMA5 $46.32, above SMA20 $45.68, above SMA60 $44.03 — but the distance between price and its own 5-day line is the story, not the order itself. The 90-day panel shows the entire quarter trading between roughly the aVWAP shelf and the mid-$47s, then a single vertical bar that carried the close through the upper Bollinger band at $49.36. That places price at the 0% anchor of the current up-swing ($42.21 on Jul 24 to $50.17 on Aug 7), with the $53.50 52-week high the only chart reference left overhead. Beneath price, the retracement ladder is dense: 23.6% at $48.29, 38.2% at $47.13 (the top of the June–July range), 50% at $46.19 and 61.8% at $45.25, which is where the 20-day line and Bollinger midline also sit. Both anchored VWAPs — $42.25 from the Nov 13, 2024 anchor and $43.77 from the May 6, 2026 anchor — are far below, so the buyer base is not underwater; the two-year chart's only unfilled gap, $33.90–$34.59 from Feb 13, 2026, is remote enough to be context rather than a live level. Bollinger width of 16.13% was expanding into this move, which is what a genuine range break looks like — and also what a one-day event spike looks like.
② Volume

The last session traded 14,310,800 shares against a 20-day average of 4,083,105 — 3.51× normal, and by a wide margin the largest bar on the 90-day panel. On the constructive side, this is the confirmation that most breakouts lack: a move through range resistance with more than triple the usual participation is not a low-volume drift that fades by Tuesday. On the cautionary side, a volume expansion of this magnitude in a single session is the signature of an event — scheduled or unscheduled — rather than of steady accumulation, and the surrounding bars are ordinary by comparison. Liquidity is not a concern here; a 20-day average above four million shares means the readings are reliable and slippage is not the issue. What the chart cannot tell you is why the volume arrived, and that distinction matters more than any level on this page.
③ MACD

MACD registered a golden cross on August 7, 2026 — the same session as the surge — with MACD at 0.37 above its signal at 0.11 and the histogram at +0.26. The cross occurred just above the zero line after a month in which MACD had fallen below it, so this is an early-cycle cross rather than a late-stage one, which is generally the more favorable configuration. The caveat is timing: a cross printed on the same bar as a 3.5× volume spike is largely a mechanical consequence of that bar, not independent evidence. The 90-day panel also shows the previous cycle — a strong MACD advance into early July followed by a dead cross and a full round trip below zero — so the useful check is whether the histogram keeps expanding over the following sessions or collapses back as soon as the single large bar rolls out of the fast average.
④ RSI

RSI(14) reads 66.90 on the 90-day frame (66.89 on two years) — strong, but still under the 70 overbought line even after a session of this size. The generator flags a regular bearish divergence: the first peak on June 26, 2026 paired a price of $47.46 with RSI 68.00, while the second peak on August 7, 2026 made a much higher price of $50.17 on a slightly lower RSI of 66.90 (the two-year frame reads 67.84 then 66.89). Higher price on lower momentum is the classic shape, but two disciplines apply here. First, the gap is small — barely more than a point of RSI across six weeks — so this is a weak-form divergence, and treating a marginal reading as a confirmed top is one of the most common ways beginners get chopped up in a breakout. Second, divergences resolve in both directions: RSI pushing decisively through 70 in the following sessions would negate it outright, while a failure to clear 70 on a fresh price high would make it considerably more serious.
⑤ Mansfield RS vs the Nasdaq Composite

Mansfield RS stands at +6.84% against the Nasdaq Composite and is rising. The two-year panel puts that number in perspective: this line was above zero through most of 2024 and early 2025, then broke down hard and spent the whole stretch from September 2025 to March 2026 deep in underperform territory, bottoming near −30. Against last week's reading of −0.68, RS has gained +7.52 points; against the prior month's +2.22, it has gained +4.62. Both changes are positive while RS itself is positive, which is the accelerating quadrant — the strongest of the four. The honest caveat is that most of the weekly gain came from the single breakout session, and a line that only crossed zero days ago has not yet demonstrated durable leadership. Relative strength that holds above zero through a pullback is what separates a real regime change from a one-bar artifact.
⑥ ATR & ADX

ADX(14) at 15.05 on the 90-day frame (14.76 on two years) is a ranging reading — below the 20 line that marks a forming trend, let alone the 25 that marks a strong one. This is the single most important qualifier on the page: whatever the price bar looks like, the underlying trend structure of the last quarter was sideways, and ADX will not confirm a trend until several more directional sessions accumulate. ADX measures strength rather than direction, so a low reading does not argue against the breakout; it simply means the breakout is unconfirmed by trend mechanics so far. ATR(14) is $1.93, or 3.84% of price, and the panel shows it turning sharply higher on the last bar as the range expanded. For sizing, a 1×ATR stop sits at $48.24 and a 2×ATR stop at $46.32, roughly 7.7% below the close — anything tighter than that in a stock now moving nearly 4% a day is likely to be taken out by ordinary noise rather than by a genuine failure.
⑦ OBV

The two timeframes disagree, and here the disagreement is the point. On the two-year frame OBV is tagged early accumulation — above its 20-day average by +3.07% with a flat slope, consistent with the long repair job since the February low. On the 90-day frame the tag is weakening: still above its MA20, and by a wide +18.44%, but with a falling slope, and the panel shows OBV rolling over through late July even as price worked higher — the chart itself annotates this as a bearish non-confirmation. In plain terms, the quarter's accumulation peaked in mid-July and had been leaking away for two weeks before the breakout bar arrived. That does not cancel the breakout, but it does mean the move is being carried by one session rather than by a build-up of buying pressure beneath it. A decisive turn higher in 90-day OBV over the coming sessions would be the cleanest confirmation available; continued decline while price holds near $50 would be the clearest warning.
Bull Case vs Bear Case
Bull Case
- Full bullish moving-average order: close $50.17 > SMA5 $46.32 > SMA20 $45.68 > SMA60 $44.03.
- The breakout carried 3.51× average volume (14.31M vs 4.08M) — participation, not a quiet drift.
- Close above the upper Bollinger band at $49.36 with width expanding to 16.13%.
- MACD golden cross on Aug 7 just above the zero line, histogram +0.26 — an early-cycle cross.
- Mansfield RS +6.84% vs the Nasdaq Composite, up +7.52 on the week and +4.62 on the month — accelerating.
- Price is far above both anchored VWAPs ($42.25 2-year, $43.77 90-day), so the buyer base is onside.
Bear Case
- Regular bearish RSI divergence: price $47.46 → $50.17 while RSI slipped 68.00 → 66.90 (Jun 26 → Aug 7).
- ADX 15.05 (90d) / 14.76 (2y) reads ranging — no trend strength yet supports the move.
- 90-day OBV is tagged weakening with a falling slope; the chart flags a bearish non-confirmation.
- A single 3.51× volume session with no catalyst identifiable from chart data is event risk, not a trend.
- The $53.50 52-week high sits only 6.2% overhead, and the two-year chart shows repeated failures in the $50–$53.50 band.
- Closes above the upper Bollinger band frequently mean-revert; the first shelf below is $48.29, then a dense ladder to $45.25.
Scenarios
| Scenario | Probability | Path | Trigger / Invalidation |
|---|---|---|---|
| Breakout follows through | 40% | Price consolidates above the $48.29 retracement instead of filling back, RSI clears 70, ADX starts rising off 15, and the $53.50 52-week high comes into range. | Trigger: a daily close above $50.17 on at-or-above average volume with 90-day OBV turning up. Invalidation: daily close back below $48.29. |
| Range break digests, then retests | 35% | The single-bar move gives back part of itself into the $48.29–$47.13 retracement zone, which is also the top of the old June–July range, and builds a base there before any further attempt higher. | Trigger: close below $48.29 on falling volume. Invalidation: sustained trade back above $49.36, the upper Bollinger band. |
| Breakout fails back into the range | 25% | The bearish RSI divergence and weakening 90-day OBV resolve downward: price loses the 50% level at $46.19 and the 2×ATR reference at $46.32, returning to the SMA20 and Bollinger midline at $45.68 and then the 61.8% level at $45.25. | Trigger: sustained trade below the 2×ATR reference at $46.32. Invalidation: a same-week recovery back above $48.29 with RS holding above zero. |
Key Levels
| Price | Role | Basis |
|---|---|---|
| $53.50 | Resistance | 52-week high — the only chart reference left overhead, 6.2% above the close |
| $50.17 | Current | Close of August 7, 2026 — also the Fibonacci 0% anchor of the current up-swing |
| $49.36 | Support | Bollinger upper band — reclaimed on the breakout bar, now the first reference beneath price |
| $48.29 | Support | Fibonacci 23.6% retracement of the $42.21 → $50.17 swing |
| $47.13 | Support | Fibonacci 38.2% — the top of the June–July congestion the breakout cleared |
| $46.32 | 2×ATR stop | Objective invalidation — 7.7% below the close, coinciding with SMA5 and just above the 50% level at $46.19 |
| $45.68 | Support | SMA20 and Bollinger midline, with the 61.8% level at $45.25 immediately beneath |
What to Watch
- Volume on the next two or three sessions. A breakout that keeps at-or-above average turnover is being accumulated; volume collapsing back toward the 4.08M average while price stalls near $50 says the 3.51× bar was a one-off.
- The $48.29 retracement. Holding it keeps the range break intact; a close beneath it turns this into a spike being filled, with $47.13 the next shelf.
- 90-day OBV slope. It is tagged weakening and falling into the breakout — a decisive turn higher would be the cleanest confirmation the chart can offer, and continued decline the clearest warning.
- ADX off the 15 line. Trend strength has to build for this to be more than a range excursion; readings pushing through 20 and toward 25 would change the structural picture.
- RSI versus 70. Clearing it negates the June-to-August bearish divergence outright; a fresh price high on a still-lower RSI would make the divergence considerably more serious.
Conclusion
Past Analyses of This Stock same ticker · newest first
Other signals from this issue same publication date · 5 stocks
This analysis is an educational interpretation of chart data and is not investment advice. Probabilities and levels are subjective estimates; every investment decision, and its outcome, is your own responsibility. The most recent session shows an outsized volume expansion whose cause cannot be determined from chart data, so technical signals alone are not a basis for acting on this stock. Chart data reflects closing prices through August 7, 2026 and does not account for events after that date.
Two Week Swing · twoweekswing.com · 4,600+ stocks screened weekly