monday.com Ltd.
$93.13 −64.7% from the 52-week high of $264.00
This analysis is based on closing-price data as of August 7, 2026. Whether you're researching how to buy monday.com Ltd. stock or you've just opened a brokerage account and are trying to time an entry, here are objective support levels and stop-loss references built from the RSI, MACD and ATR indicators.
MNDY closed the week at $93.13 with every short-term moving average in ascending order — close above SMA5 $90.97, above SMA20 $83.47, above SMA60 $80.01 — and a MACD golden cross dated Jul 28, 2026 behind it. That alignment is real, but it is forming inside the wreckage of a year-long decline: the stock is 64.7% below its $264.00 52-week high, Mansfield RS reads −33.47% against the Nasdaq Composite, and the two-year anchored VWAP sits 20.9% overhead at $112.60. ADX at 16.7 confirms what that combination implies — this is a range being repaired, not a trend being ridden. The sections below read the alignment and the downtrend against each other rather than choosing one.
Snapshot as of the August 7, 2026 close · values taken from the chart data file
| Metric | Value | Read |
|---|---|---|
| Close | $93.13 | Upper end of the four-month base |
| 52-week high / low | $264.00 / $57.50 | −64.7% from the high, +62.0% off the low |
| SMA5 / SMA20 / SMA60 | $90.97 / $83.47 / $80.01 | Price above all three; stack in ascending order |
| Bollinger upper / mid / lower | $97.19 / $83.47 / $69.75 | Close is inside the band, near the top; band width 32.88% |
| aVWAP (90d, anchored May 11, 2026) | $80.06 | Price 16.3% above the short-term anchor |
| aVWAP (2y, anchored Aug 11, 2025) | $112.60 | Long-term buyers are 20.9% underwater — overhead supply |
| RSI(14) | 61.80 (2y) / 61.82 (90d) | Upper half, below overbought; no divergence detected |
| Mansfield RS vs Nasdaq Composite | −33.47% | Underperform, rising slope (prev week −36.59, prev month −48.10) |
| MACD / signal / histogram | 3.5435 / 2.5394 / +1.0041 | Golden cross dated Jul 28, 2026; both lines above zero |
| ADX(14) | 16.75 (2y) / 17.01 (90d) | Ranging — below the 20 threshold where a trend is considered forming |
| ATR(14) | $5.59 (6.00% of price) | Wide daily range; size positions off this, not a tighter borrowed number |
| OBV | −50,807,800 (2y) / −2,804,200 (90d) | Early accumulation (2y, flat, +5.77% vs MA20) · Accumulation (90d, rising, +52.61% vs MA20) |
| Volume / 20-day average | 2,470,600 / 1,657,170 = 1.49× | Above average on the gap-up session, short of a 2× spike |
| 1× / 2× ATR stop reference | $87.54 / $81.96 | Objective invalidation levels below the close |
① Price & Moving Averages
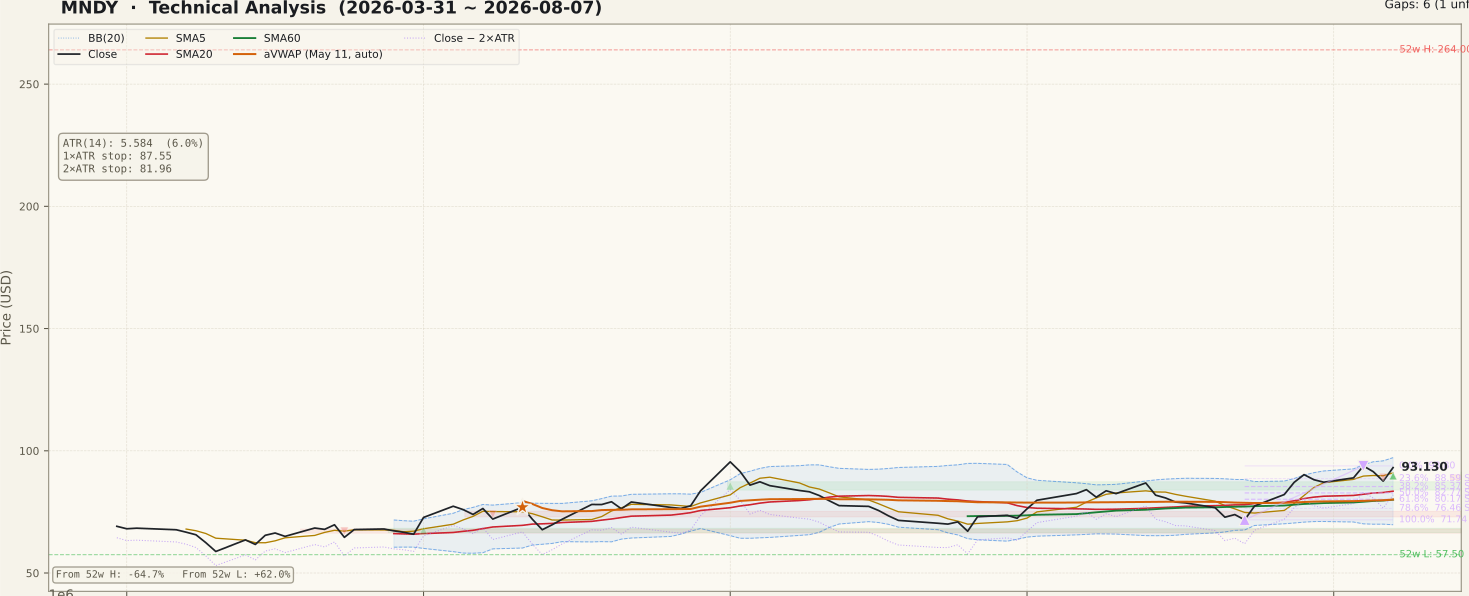
The moving-average stack is the textbook ascending configuration a trend screen looks for: close $93.13 above SMA5 $90.97 above SMA20 $83.47 above SMA60 $80.01. What that stack sits inside matters just as much. The two-year Fibonacci grid is anchored on the Jan 26 high of $130.06 and the Feb 13 low of $72.38, and its levels are resistance on the way back up: the 23.6% line at $85.99 has been cleared, the 38.2% line at $94.41 sits immediately overhead, then $101.22 at 50% and $108.03 at 61.8%. Note that the grid's anchor low is not the bottom — the 52-week low of $57.50 was printed later, so this is the retracement of one detected leg, not of the whole decline. The 90-day grid runs the other way, anchored on the Jul 23 low of $71.74 and the Aug 4 high of $93.80, giving support at $88.59, $85.37 and $82.77. The two anchored VWAPs tell the whole story in two numbers: the 90-day anchor sits at $80.06 below price, while the two-year anchor from Aug 11, 2025 sits at $112.60, 20.9% above it — recent buyers are ahead, everyone from a year ago is not.
② Volume

Last-session volume was 2,470,600 shares against a 20-day average of 1,657,170 — a ratio of 1.49×. That is meaningful participation but not a spike; the panel reserves its highlight colour for sessions at twice the average, and this one does not qualify. It is enough to keep the usual beginner trap at bay — a move on below-average volume would be the unconfirmed kind — without being the kind of turnover that marks a regime change. Liquidity itself is not a concern here: an average of roughly 1.66 million shares in a stock trading in the $80s and $90s is a deep enough book that spread and slippage are ordinary costs rather than a structural risk. The one detail worth carrying forward is that this above-average session was also a gap session, which the price panel records as an unfilled support gap between $88.13 and $91.30 dated Aug 7 — the chart data records the gap but says nothing about what caused it.
③ MACD

MACD reads 3.5435 with the signal line at 2.5394 and a histogram of +1.0041, from a golden cross dated Jul 28, 2026. Both lines are above zero, so this is momentum re-accelerating inside positive territory rather than the deep below-zero cross that marks an early turn off a bottom. The qualification is written on the 90-day panel itself: this is the fourth cross in the window, with golden and dead crosses alternating through April, June and July as price rotated inside the base. In a ranging stock a MACD cross is a description of the last two weeks, not a forecast of the next two, and the histogram's height here is a function of how fast price came off the Jul 23 low rather than evidence of a durable trend.
④ RSI

RSI(14) is 61.80 on the two-year series and 61.82 on the 90-day — in the upper half, clearly short of the 70 overbought line, with no divergence flagged in the data on either timeframe. That is a constructive but unremarkable reading: there is room before momentum becomes stretched, and nothing in the oscillator argues that the current advance is exhausted. The 90-day panel shows only one visit to the overbought zone in the whole window, in early June, and price rolled over from it into the July low. On the two-year panel the oscillator spent the first quarter of 2026 repeatedly in the oversold zone, which is the shape of a decline finding a floor — worth remembering as context, but a bottoming signal is not a buy signal.
⑤ Mansfield Relative Strength

This is the number that keeps the page honest. Mansfield RS is −33.47% versus the Nasdaq Composite — deep in the underperform zone — with a rising slope. A week ago it read −36.59 and a month ago −48.10, so the change is +3.12 on the week and +14.63 on the month. In negative territory, a positive change is improvement toward zero, not acceleration: the gap to the index is closing quickly, but the stock is still losing to it. The two-year panel makes the scale of the repair visible — RS traded above zero through mid-2025, collapsed into deeply negative territory after the August 2025 breakdown, bottomed early in 2026 and has been climbing since. Improvement of this speed is exactly what a genuine base looks like from the relative-strength side; it becomes leadership only when the line crosses zero, and it has roughly 33 points to travel before it does.
⑥ ATR & ADX

ATR(14) is $5.59, or 6.00% of the $93.13 close, and the 90-day panel shows it turning back up through the recent advance. A stock that routinely covers six percent in a session can travel from the close to the 38.2% retracement at $94.41 and back inside a single day without any of it meaning anything, which is why the invalidation references are set where they are: $87.54 at 1× ATR and $81.96 at 2× ATR, the latter 12.0% below the close. ADX is 16.75 on the two-year series and 17.01 on the 90-day, both under the 20 line and firmly in ranging territory. ADX measures strength, not direction — a low reading alongside an ascending moving-average stack says the stack has been assembled by a drift inside a range, not by the sustained directional pressure that carries a swing.
⑦ On-Balance Volume

Both timeframes point the same way and disagree only in degree, so both belong on the page. On the 90-day series OBV is −2,804,200 against a 20-day average of −5,917,190 — above its average, rising, tagged accumulation, a divergence of +52.61%. On the two-year series OBV is −50,807,800 against an average of −53,920,790: also above its average and tagged early accumulation, but with a flat slope and a divergence of only +5.77%. The pattern is consistent with the rest of the page — recent buying pressure is real and improving, while the two-year cumulative line remains deeply negative, the legacy of the distribution that followed the August 2025 breakdown. Accumulation off a very low base is repair; it is not the same thing as demand overwhelming supply.
Bull Case vs Bear Case
Bull Case
- Full ascending moving-average stack: close $93.13 above SMA5 $90.97, SMA20 $83.47 and SMA60 $80.01.
- MACD golden cross dated Jul 28, 2026 with both lines above zero and a histogram of +1.0041.
- Mansfield RS improving fast: −48.10 a month ago to −36.59 a week ago to −33.47 — +14.63 points on the month.
- OBV above its 20-day average on both timeframes — accumulation and rising at +52.61% on the 90-day, early accumulation at +5.77% on the two-year.
- The Aug 7 session left an unfilled support gap between $88.13 and $91.30 on 1.49× average volume, directly beneath price.
- Price is 16.3% above the 90-day anchored VWAP of $80.06 and 62.0% off the $57.50 52-week low, with higher lows since April.
Bear Case
- The dominant trend is still down: the close is 64.7% below the $264.00 52-week high.
- Mansfield RS −33.47% versus the Nasdaq Composite — improving from a very low base is not outperformance.
- The two-year anchored VWAP at $112.60 is 20.9% overhead; a year of buyers there are underwater and represent supply.
- ADX 16.75 (2y) and 17.01 (90d) — ranging, with no measured trend strength behind the stack.
- Four unfilled resistance gaps overhead — $109.58–$112.50 (Feb 3), $121.77–$125.55 (Jan 29), $167.50–$176.18 (Nov 10) and $189.36–$241.27 (Aug 11, 2025).
- Price is pressed against a decision zone — the 38.2% retracement at $94.41 and the upper Bollinger Band at $97.19 — with ATR at 6.00% of price making whipsaw through it routine.
Scenarios
| Scenario | Probability | Path | Trigger / Invalidation |
|---|---|---|---|
| Base extends higher | 40% | The $94.41 retracement gives way, the upper band at $97.19 follows, and price works toward the 50% line at $101.22 with the Feb 3 gap at $109.58–$112.50 as the next shelf. | Trigger: daily close above $94.41 on volume above the 1,657,170 average. Invalidation: close back under SMA20 at $83.47. |
| Range holds, price rotates | 35% | With ADX at 16.7 the stock does what it has done since April — stalls at the $94.41 shelf and rotates back through the $88.13–$91.30 gap toward SMA20 and the Bollinger mid at $83.47. | Trigger: repeated closes under $94.41 with the 90-day 23.6% level at $88.59 holding. Invalidation: a decisive close outside $81.96–$101.22. |
| Rebound fails inside the downtrend | 25% | The Aug 7 gap fills and gives way, SMA20 at $83.47 is lost, and price returns toward the 90-day swing anchor at $71.74 and the Feb 13 low at $72.38. | Trigger: close below the 2× ATR reference at $81.96. Invalidation: defending the $88.13 gap floor on the first test. |
Key Levels nearest to price first, descending
| Level | Role | Basis |
|---|---|---|
| $101.22 | Resistance | Two-year Fibonacci 50% retracement of the Jan 26 – Feb 13 decline |
| $97.19 | Resistance | Upper Bollinger Band; band width 32.88% |
| $94.41 | Resistance | Two-year Fibonacci 38.2% retracement — nearest overhead level; the Aug 4 swing high at $93.80 sits just beneath it |
| $93.13 | Current close | Aug 7, 2026 close |
| $91.30 – $88.13 | Support | Unfilled gap from the Aug 7 session; the 90-day 23.6% retracement at $88.59 sits inside it |
| $83.47 | Support | SMA20 and Bollinger mid-band; the 90-day 50% retracement at $82.77 sits just below |
| $81.96 | 2× ATR stop | Objective invalidation, 12.0% below the close; SMA60 at $80.01 and the 90-day aVWAP at $80.06 sit just under it |
What to Watch
- The $94.41 shelf. The 38.2% retracement is the first real overhead level. A daily close through it on volume above the 1,657,170 average is the difference between an advance and a range high.
- The Aug 7 gap. Whether $88.13–$91.30 stays unfilled. Gaps that hold act as a floor; a fill followed by a close underneath is the first structural crack in the four-month base.
- Relative strength crossing zero. Mansfield RS has travelled +14.63 points in a month and still sits at −33.47%. The distinction between repair and leadership is the zero line, not the slope.
- ADX turning up. A move from 16.7 through 20 toward 25 would be the first measured evidence that the moving-average stack reflects a trend rather than a drift.
- The $112.60 anchored VWAP. The two-year anchor from Aug 11, 2025 marks where a year of underwater buyers sit; any approach to it is where supply should be expected to reappear.
Conclusion
Past Analyses of This Stock same ticker · newest first
Other signals from this issue same publication date · 5 stocks
This analysis is an educational interpretation of chart data and is not investment advice. Probabilities and levels are subjective estimates; every investment decision, and its outcome, is your own responsibility. A stock trading far below its 52-week high may be repairing a base or continuing a decline, and the chart alone cannot distinguish between the two. Where a price move appears to be driven by a fundamental catalyst that the chart cannot identify, technical signals alone are not a basis for buying.
Two Week Swing · twoweekswing.com · 4,600+ stocks screened weekly