The RealReal, Inc.
$12.30 −29.3% from 52-week high
This analysis is based on closing-price data as of August 7, 2026. Whether you're researching how to buy The RealReal, Inc. stock or you've just opened a brokerage account and are trying to time an entry, here are objective support levels and stop-loss references built from the RSI, MACD and ATR indicators.
The RealReal broke down from a $17.39 peak early in 2026 and bottomed at $8.12 on March 30; since then the chart has been a four-month range with a stubborn ceiling around $12.8–$13.0 that has turned back every rally. The current attempt is the third: price climbed from the July 24 low of $11.13 to a $12.77 swing high on August 6 with a July 28 MACD golden cross and on-balance volume above its 20-day average on both timeframes. The August 7 session is what makes this chart interesting — it opened with an upside gap, traded through the $13.00 ceiling intraday, and then closed all the way back at $12.30 on 3.55× the average volume. The setup is a range top being tested with real participation, and so far the sellers there have kept the upper hand.
Snapshot all values from the August 7, 2026 close
| Item | Value | Reading |
|---|---|---|
| Close | $12.30 | −29.3% from 52w high / +126.9% from 52w low |
| 52-week high / low | $17.39 / $5.42 | Mid-range within an unusually wide yearly span |
| SMA 5 / 20 / 60 | $12.59 / $11.75 / $10.87 | Above SMA20 and SMA60, but the close slipped back under SMA5 |
| Bollinger (upper / mid / lower) | $12.98 / $11.75 / $10.52 | Band width 20.96% — moderate; close in the upper half |
| aVWAP (90d, anchored May 8, 2026) | $10.95 | Price well above — buyers since the early-May break are in profit |
| aVWAP (2y, anchored May 9, 2025) | $10.32 | Price above the long-term anchor |
| RSI (14) | 57.4 | Upper-neutral, room before 70; no divergence flagged |
| Mansfield RS (vs the Nasdaq Composite) | −5.7% | Still below zero: +9.2 pts better than a month ago, but −4.1 pts on the week |
| MACD (12,26) | 0.38 / signal 0.30 / hist +0.08 | Golden cross on Jul 28, both lines above zero |
| ADX (14) | 24.2 (2y frame 23.7) | Emerging — still under the 25 trend threshold |
| ATR (14) | $0.72 (5.8% of price) | Wide daily ranges — basis for stop sizing |
| OBV | 2y: early accumulation (+0.89% vs MA20, flat) / 90d: accumulation (+13.84%, rising) | Above its MA20 on both timeframes |
| Volume vs 20-day avg | 3.55× (12,127,100 vs 3,419,420) | Heaviest session of the window — into a lower close |
| 1× / 2× ATR stop | $11.58 / $10.87 | Objective invalidation references |
① Price & Moving Averages
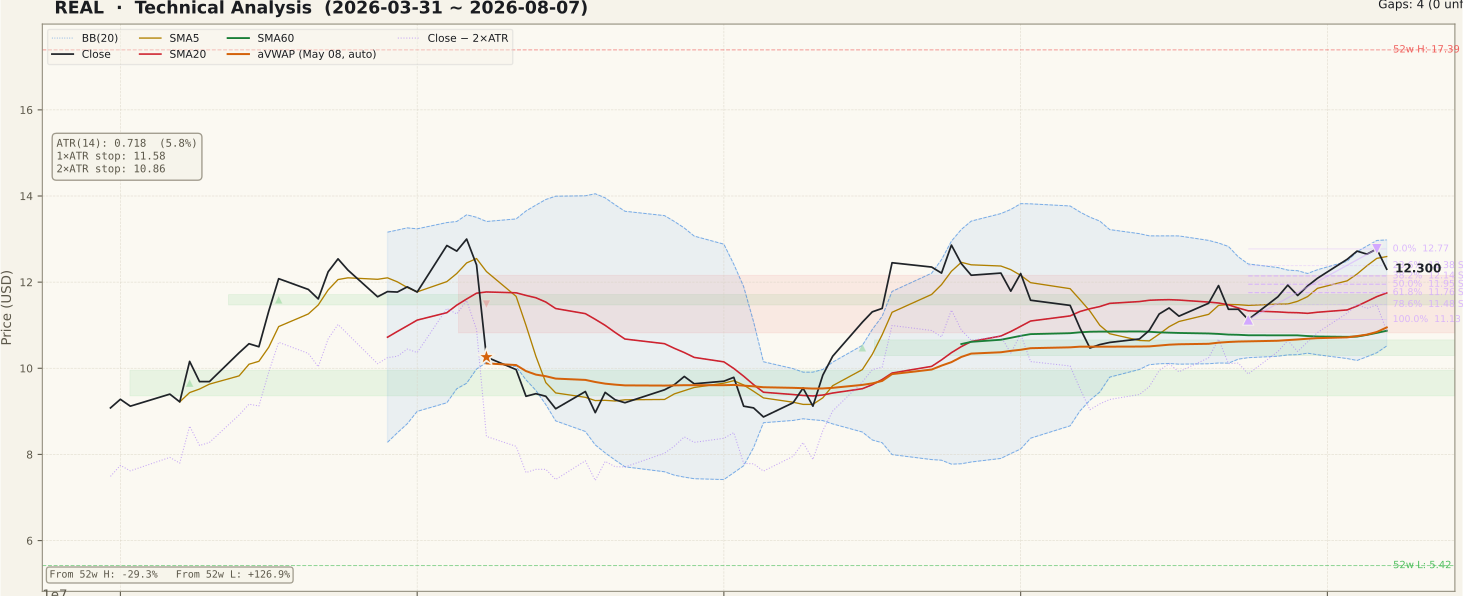
The two-year frame explains the shape of everything else. REAL ran from roughly $2.50 in the autumn of 2024 to a 52-week high of $17.39 in early 2026, then gave the last leg of that advance back in a steep February–March decline that ended at $8.12 on March 30. What has followed is not a new uptrend but a range: rallies in early May, late June and now early August have all stalled in the same $12.8–$13.0 pocket, while each pullback low has come in higher than the last. The 90-day panel shows the current leg cleanly — a ten-session climb from $11.13 on July 24 to a $12.77 swing high on August 6, carrying price above SMA20 ($11.75) and SMA60 ($10.87) and above both anchored VWAPs. The moving-average stack is constructive but not yet fully aligned: the close of $12.30 sits under SMA5 at $12.59, so the newest short-term average has flipped to overhead. Above price, resistance is dense and specific — the upper Bollinger Band at $12.98 and the two-year Fibonacci 0% anchor at $13.00 (the May 6 swing high) sit almost on top of each other, and August 7 traded through that zone intraday to a high of $13.82 before closing back below it. Underneath, the 23.6% retracement of the current leg at $12.38 was already lost on that close, leaving $12.14 (38.2%) as the first shelf, then the $11.75–$11.85 pocket where SMA20, the Bollinger midline, the 61.8% retracement of the 90-day swing and the 23.6% retracement of the two-year swing converge. The July 24 low at $11.13 is the last structural support before the 2×ATR line. The only unfilled gap on the two-year chart sits at $6.05–$6.32 from August 2025 — far below and relevant only in a full round trip.
② Volume

The last bar dominates the panel: 12,127,100 shares against a 20-day average of 3,419,420, or 3.55× normal, and the session before it also cleared the 2× spike threshold. Liquidity is not a concern in this name — the 20-day average alone is well over three million shares — so this is a genuine crowd, not a thin-tape artifact. The problem is where that crowd showed up. Price gapped higher, tagged $13.82 intraday, and finished at $12.30, below the previous session's $12.77 swing high. A gap of that size does not come from chart mechanics; it is the footprint of news, and the reversal that followed means the heaviest supply of the entire 90-day window was absorbed at the ceiling rather than above it. Beginners often read a huge volume bar as automatic confirmation — here the honest reading is the opposite: volume confirmed the rejection. What would change the interpretation is follow-through. If the next sessions pull back on shrinking volume and then push through $13.00 on volume at or above average, the spike marks accumulation; if red volume keeps expanding beneath the ceiling, it marks distribution.
③ MACD

MACD reads 0.38 against a signal of 0.30 with a histogram of +0.08, following a golden cross dated July 28. Both lines are above zero, which is the constructive part — momentum is positive, not merely improving from a deficit. The caveats come from context. The absolute readings are modest next to this stock's own history, where the two-year panel shows the line reaching above 1.0 in past thrusts and below −1.0 in the February decline, so the current cross is a small signal on this scale. The 90-day panel also shows how quickly signals flip inside a range: several crosses in both directions since May, most of them reversed within a couple of weeks. The histogram is the practical tell from here — expanding green bars alongside a close above $13.00 would make the July 28 cross meaningful, while a fade back toward zero while price sits under $12.77 would mark the momentum peak of this leg.
④ RSI

RSI stands at 57.4 on both timeframes — in the upper half of neutral, with room before the 70 overbought line and well clear of the 30 oversold zone. The 90-day arc traces the range faithfully: a slide toward the low 30s after the early-May breakdown, a recovery to just above 70 in early July, a drop back toward the mid-40s mid-month, and the current climb into the upper 50s that has already ticked down from a slightly higher reading. No divergence is flagged in the data on either timeframe, and the peak fields are empty, so there is no bearish non-confirmation to report at these highs — it would be wrong to infer one from the picture alone. The useful takeaway for a newer reader is that 57.4 is a permissive reading rather than a signal: it neither warns of exhaustion nor confirms a breakout. The levels that matter next are 70 on the way up, which would accompany a genuine push through the ceiling, and 50 on the way down, which has marked the failure point of the previous two rally attempts in this range.
⑤ Mansfield Relative Strength

Mansfield RS versus the Nasdaq Composite reads −5.7%, which means REAL is still lagging the index despite the price recovery — and this is the panel that most complicates the bullish read. The two changes point in opposite directions. A month ago RS was −14.8, so the line has improved by +9.2 points over the month; a week ago it was −1.6, so it has fallen by 4.1 points over the week. In negative territory an improving line means the deficit is closing, not that leadership exists, and the last week moved the wrong way even as price rose — that combination means the broader market rose faster than REAL did. The data tags the RS slope as rising, which reflects the month-scale recovery rather than the past few sessions. The two-year panel keeps this in proportion: RS was above +100 during the 2024–2025 advance and has spent most of 2026 below zero. Deep or persistent sub-zero relative strength is a warning that outranks a lot of bullish short-term evidence, and the zero line is the level that would change the assessment.
⑥ ATR & ADX

ADX is 24.2 on the 90-day frame and 23.7 on the two-year frame, tagged emerging — below the 25 threshold that marks a trend worth trading as a trend. That reading matches the picture: four months of range, not direction. Remember that ADX measures intensity rather than direction, so a rising ADX here would only tell you the range is resolving, not which way. ATR is $0.72, which is 5.8% of price, and the panel shows it jumping in the final session as the daily range widened. That number governs risk directly: the 1×ATR reference sits at $11.58 and the 2×ATR reference at $10.87, which is 11.7% below the close. A stop placed nearer than about $0.72 from entry will be removed by ordinary daily noise, so the correct adjustment is a smaller position rather than a tighter stop. The two-year chart also shows this stock is capable of single sessions that travel straight through a level, which is exactly why the invalidation line should be decided before an entry, not after.
⑦ OBV (On-Balance Volume)

The two timeframes agree in direction and differ in conviction. On the 90-day frame OBV is tagged accumulation: 13.84% above its 20-day average with a rising slope, having climbed steadily through the late-July advance. On the two-year frame the tag is early accumulation, only 0.89% above its MA20 with a flat slope — barely above the line after the long 2026 decline. Read together, buying pressure has genuinely improved over the past few weeks but has not yet repaired the damage on the longer horizon. The panel also shows a sharp one-bar drop at the very end, the fingerprint of that 3.55× volume session closing lower; the 90-day line is still above its average, so the constructive tag survives, but the cushion is smaller than it was. OBV lags at turning points and a single strong session can flip it either way, which is why the level to monitor is simply whether the 90-day line stays above its MA20 through the next pullback.
Bull Case vs Bear Case
Bull Case
- Close $12.30 holds above SMA20 $11.75 and SMA60 $10.87, and above both anchored VWAPs (90d $10.95, 2y $10.32) — buyers from both anchors are in profit.
- MACD golden cross on July 28 with both lines above zero (0.38 / 0.30) and a positive histogram of +0.08.
- Mansfield RS has improved +9.2 points in a month, from −14.8 to −5.7 — the strongest repair in the RS line since the February breakdown.
- OBV sits above its 20-day average on both timeframes: 90-day accumulation at +13.84% and rising, two-year early accumulation at +0.89%.
- The March 30 low of $8.12 has held through two subsequent selloffs, with each pullback trough since arriving higher — the most recent at $11.13 on July 24.
- RSI 57.4 leaves room before the overbought zone, and no bearish divergence is flagged on either timeframe.
Bear Case
- Mansfield RS is still −5.7% below zero versus the Nasdaq Composite, and it fell 4.1 points over the past week even as price rose — the index outran the stock.
- August 7 traded to $13.82 intraday, above the $13.00 ceiling, and closed at $12.30 on 3.55× average volume — the heaviest supply of the window arrived exactly at resistance.
- The close is back under SMA5 $12.59 and under the 23.6% retracement of the current leg at $12.38, the first shelf lost since the July 24 low.
- Price is still −29.3% below the 52-week high of $17.39, and $12.8–$13.0 has capped every rally since May 6.
- ADX 24.2 is below the 25 trend threshold on both frames — four months of range behaviour, with no confirmed directional trend to lean on.
- ATR at 5.8% of price puts the 2×ATR invalidation 11.7% away; the daily noise in this stock is large enough that ordinary volatility alone can reach it.
Scenarios
| Scenario | Probability | Path | Trigger / Invalidation |
|---|---|---|---|
| Rejection at the range top | ~45% | The August 7 reversal holds as the high of this leg; price drifts back through $12.14 toward the $11.75–$11.85 pocket where SMA20, the Bollinger midline and two Fibonacci levels converge, and the four-month range continues. | Trigger: repeated closes under $12.77 with volume fading. Constructive while $11.13 holds; losing it opens the lower half of the range. |
| Confirmed break of the ceiling | ~30% | Price digests the reversal, reclaims $12.77 and then closes above the $12.98–$13.00 band on real participation; above there the chart offers no reference until far higher, with the 52-week high at $17.39. | Trigger: a daily close above $13.00 on volume at or above the 20-day average, with Mansfield RS crossing zero. Invalidated by a close back under $12.14. |
| Failed leg back to the range floor | ~25% | The heavy-volume rejection turns into sustained supply: price loses $11.75, then the July 24 low at $11.13, and slides toward the $10.87 line where SMA60 and the 2×ATR stop sit together. | Trigger: a daily close below $11.13 on expanding volume, with OBV dropping under its MA20. A close below $10.87 voids the setup outright. |
Key Levels
| Price | Role | Basis |
|---|---|---|
| $13.00 | Resistance | Fibonacci 0% of the two-year up swing — May 6, 2026 swing high; upper Bollinger Band $12.98 immediately below |
| $12.77 | Resistance | Fibonacci 0% of the 90-day up swing — August 6 swing high; SMA5 $12.59 just under it |
| $12.30 | Current price | August 7, 2026 close |
| $12.14 | Support | Fibonacci 38.2% of the 90-day swing — first shelf below the close (23.6% at $12.38 was lost) |
| $11.75 | Support | SMA20 and Bollinger midline; 61.8% of the 90-day swing at $11.76 and 23.6% of the two-year swing at $11.85 in the same pocket |
| $11.13 | Support | July 24 swing low — Fibonacci 100% of the current 90-day up swing |
| $10.87 | Stop-loss | 2×ATR stop — objective invalidation (−11.7% from the close); SMA60 $10.87 sits on the same line |
What to Watch
- A daily close above $13.00: the intraday tag at $13.82 does not count — the ceiling has only been cleared when a session closes above $12.98–$13.00, ideally on volume at or above the 20-day average.
- Volume character after the 3.55× session: shrinking volume on the pullback reads as digestion; expanding volume on lower closes reads as supply returning at resistance.
- Mansfield RS and the zero line: the month-scale repair from −14.8 to −5.7 is real, but the past week went backwards — a crossing above zero is the confirmation that has been missing all year.
- The $11.75–$11.85 pocket: SMA20, the Bollinger midline and two Fibonacci levels converge there; holding it keeps the higher-low sequence since March 30 intact.
- OBV versus its MA20 on the 90-day frame: currently +13.84% and rising; a drop below the average would remove the last piece of volume support for the bullish read.
Conclusion
Past Analyses of This Stock same ticker · newest first
Other signals from this issue same publication date · 5 stocks
This analysis is an educational interpretation of chart data and is not investment advice. Probabilities and levels are subjective estimates; every investment decision, and its outcome, is your own responsibility. Technical signals describe what the chart has done, not what the company will do — always weigh fundamentals and your own risk tolerance before acting.
Two Week Swing · twoweekswing.com · 4,600+ stocks screened weekly