Fluor Corporation
$57.00 −1.1% from 52-week high
This analysis is based on closing-price data as of August 7, 2026. Whether you're researching how to buy Fluor Corporation stock or you've just opened a brokerage account and are trying to time an entry, here are objective support levels and stop-loss references built from the RSI, MACD and ATR indicators.
Fluor spent the whole of 2026 grinding higher inside a range whose ceiling sat at $53.7–$54.8, recovering from a $39.33 low set on the last day of 2025. On Friday, August 7 that ceiling stopped mattering: the stock opened with a gap above the entire zone, ran to a new 52-week high of $57.65 intraday and closed at $57.00 — a single-session advance of 16.9% from the previous close of $48.75 on 3.15× the 20-day average volume. That is the highest close in a year and it leaves an unfilled gap at $50.73–$53.63 directly underneath. A one-day repricing of this size is a news-shaped event rather than a chart-shaped one, so the honest framing is a breakout with real participation whose durability has not been tested by a single session yet.
Snapshot all values from the August 7, 2026 close
| Item | Value | Reading |
|---|---|---|
| Close | $57.00 | −1.1% from 52w high / +44.9% from 52w low |
| 52-week high / low | $57.65 / $39.33 | The high was printed intraday in this same session |
| SMA 5 / 20 / 60 | $51.58 / $50.70 / $49.63 | Full bullish stack — close above all three, and each average above the next |
| Bollinger (upper / mid / lower) | $54.80 / $50.70 / $46.60 | Close finished 4.0% above the upper band; width 16.18% |
| aVWAP (90d, anchored May 8, 2026) | $49.13 | Price far above — buyers since the May reset are in profit |
| aVWAP (2y, anchored Aug 1, 2025) | $45.82 | Price above the long-term anchor by a wide margin |
| RSI (14) | 63.8 (90d frame 63.8) | Upper-neutral, still under 70 — but a bearish divergence is flagged |
| Mansfield RS (vs the S&P 500) | +10.3% | Above zero and rising: +9.9 pts on the week, +11.5 pts on the month |
| MACD (12,26) | 0.40 / signal 0.06 / hist +0.34 | Golden cross dated Aug 7, both lines just above zero |
| ADX (14) | 15.7 (90d frame 16.0) | Ranging / weak — well below the 25 trend threshold |
| ATR (14) | $2.61 (4.59% of price) | Expanded sharply in the last session — basis for stop sizing |
| OBV | 2y: early accumulation (+48.7% vs MA20, flat) / 90d: early accumulation (+9.61%, flat) | Above its MA20 on both frames, but the slope is flat at a 52-week high |
| Volume vs 20-day avg | 3.15× (7,957,500 vs 2,524,910) | Heaviest session since the December base — into a close near the high |
| 1× / 2× ATR stop | $54.39 / $51.77 | Objective invalidation references |
① Price & Moving Averages
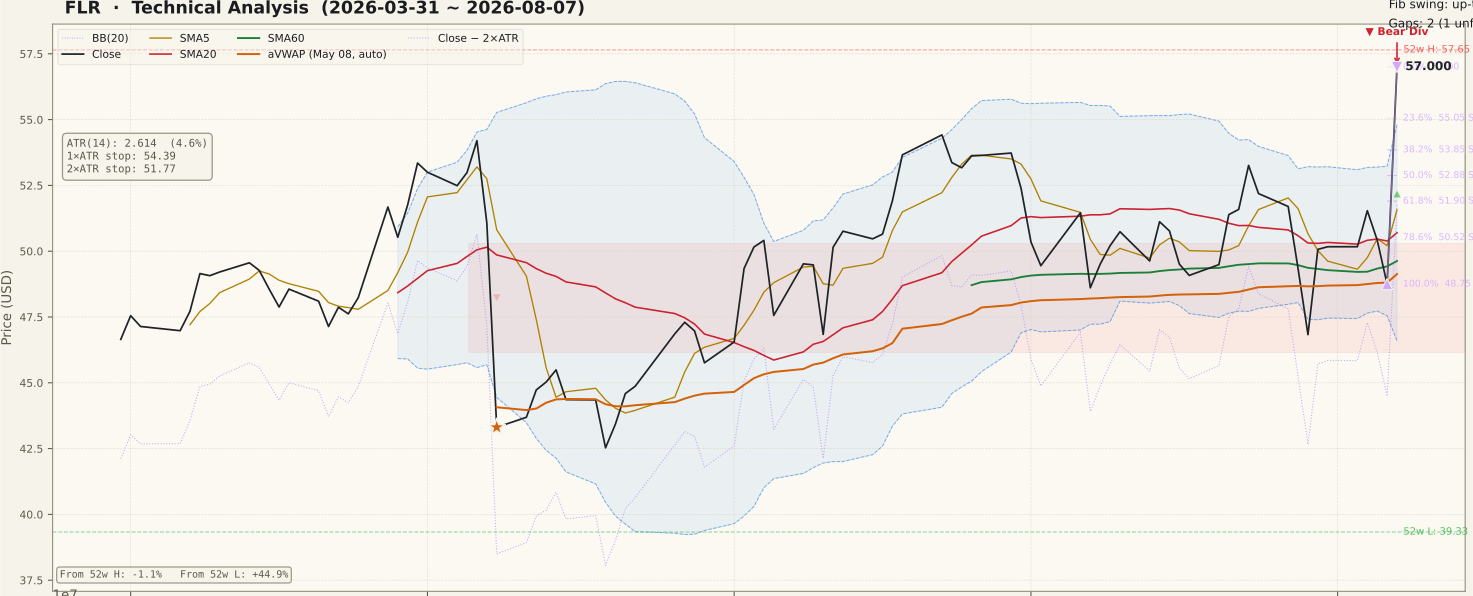
The two-year frame is a story of two collapses and one long repair. Price peaked at $60.10 in November 2024, gapped down violently on November 8 of that year — the gap between $52.30 and $58.27 is still unfilled and price is now trading inside it — and slid to $29.20 by April 2025. The recovery to $57.50 in late July 2025 ended in a second one-day collapse on August 1, 2025, which is why the two-year anchored VWAP sits at $45.82. From the December 31, 2025 low of $39.33 the chart has been a patient, higher-low advance with a firm ceiling: every rally in February, May and June 2026 stalled between $53.7 and $54.8, with the highest close of that year-long stretch at $54.42 on June 22. Friday cleared all of it in one move. The close of $57.00 sits above SMA5 $51.58, SMA20 $50.70 and SMA60 $49.63 in a fully aligned stack, above both anchored VWAPs, and 4.0% above the upper Bollinger Band at $54.80. Because the swing being measured is a single session, the Fibonacci grid is unusually tight: 23.6% at $55.05, 38.2% at $53.85, 50% at $52.88 and 61.8% at $51.90, with the 100% line back at the August 6 close of $48.75. The structurally important number is $53.63 — the top of Friday's unfilled gap and the session's own low — because a breakaway gap that stays open is what separates a repricing from a spike.
② Volume

Friday traded 7,957,500 shares against a 20-day average of 2,524,910, or 3.15× normal, and it is by far the tallest bar in the 90-day panel. Liquidity is not an issue here — the average session already turns over more than two million shares, so this is a genuine crowd rather than a thin-tape artifact. The quality of the bar matters as much as its height: the close at $57.00 came near the session high of $57.65 and well above the low of $53.63, so the buying was not faded into the bell. That is the textbook definition of a volume-confirmed breakout, and it is the opposite of the common beginner error of trusting a breakout that happens on volume below average. The caveat is the mirror image: the two-year panel shows this stock's biggest volume bars have historically marked violent one-day repricings in both directions, including the 25.5-million-share collapse of August 1, 2025. Confirmation from here is ordinary — the next few sessions should pull back on shrinking volume rather than give the move back on expanding red volume.
③ MACD

MACD reads 0.40 against a signal of 0.06 with a histogram of +0.34, and the golden cross is dated August 7 — the same session as the price move. Both lines are above zero, which is constructive, but the crossover happened from a flat, near-zero base after weeks of chop, so almost the entire histogram expansion comes from one bar. That is worth stating plainly because a cross generated by a single gap is the least confirmed kind: the 90-day panel shows four crosses since May, most of them reversed within two weeks, and the two-year panel shows the line reaching above 3.0 in genuine thrusts, so 0.40 is a small reading on this stock's own scale. What would turn it into something durable is banal — a second and third session of expanding green histogram bars while price holds above the gap. A histogram that rolls back toward zero while price slips under $53.63 would mark Friday as an isolated event rather than the start of a momentum phase.
④ RSI

RSI finished at 63.8 on the two-year frame and 63.8 on the 90-day frame — firmly in the upper half of neutral and, perhaps surprisingly after a 16.9% session, still short of the 70 overbought line. The reason is that the fourteen sessions feeding the calculation include the slide from $53.26 on July 23 down to $46.83 on July 29, so one strong bar cannot lift the average all the way. The data flags a bearish divergence on both timeframes, comparing the June 29 peak (price $53.73, RSI 65.78) with Friday (price $57.00, RSI 63.80): a higher price high on a lower RSI reading. Treat that with care rather than as a conclusion. Divergences measured across a gap event are unreliable, the two readings are less than two points apart, and a divergence is a possibility of reversal that requires price confirmation — here that confirmation would be a failure back inside the gap. The levels worth tracking are 70 above, which a genuine trend leg would clear and then hold, and 50 below, which has marked the failure point of every 2026 rally attempt in this name.
⑤ Mansfield Relative Strength

Mansfield RS versus the S&P 500 reads +10.3% with a rising slope, and this is the panel where Friday changed the most. A week ago the line stood at +0.4 and a month ago at −1.2, so the stock has gained 9.9 points on the week and 11.5 points on the month — it has moved from hugging the zero line to clear, accelerating outperformance in positive territory. The two-year panel puts that in context: RS spent most of the second half of 2025 between −10 and −25 after the August collapse, climbed back to roughly +13 in March 2026, then oscillated around zero for four months. The one honest qualification is arithmetic rather than interpretive: essentially the entire weekly jump was produced by a single session, so the reading describes what happened on Friday more than a multi-week trend of leadership. A newer reader should note the useful discipline here — RS above zero means the stock is outrunning the index, and staying above zero over the coming weeks is what would turn a one-day spike in the line into evidence of genuine relative leadership.
⑥ ATR & ADX

ADX is 15.7 on the two-year frame and 16.0 on the 90-day frame, both tagged ranging — a long way below the 25 that marks a trend strong enough to lean on. That is not a contradiction of the breakout; ADX is a fourteen-period average of directional movement and one session cannot move it, so the low reading describes the four months of chop that preceded Friday rather than what happened on Friday. Remember also that ADX measures intensity and not direction: a rise from here would only confirm that the range has resolved, not which way it resolved. ATR tells the more actionable story. At $2.61, or 4.59% of price, it jumped sharply in the final session as the daily range widened, which pushes the objective invalidation lines out with it — the 1×ATR reference sits at $54.39 and the 2×ATR reference at $51.77, some 9.2% below the close. A stop placed inside $2.61 of the close will be taken out by ordinary daily noise after an expansion like this, so the correct adjustment is a smaller position rather than a tighter stop.
⑦ OBV (On-Balance Volume)

Both timeframes carry the same tag, early accumulation, and both show the line above its 20-day average — by 48.7% on the two-year frame and 9.61% on the 90-day frame — but the slope is recorded as flat on each. That combination is the main piece of unfinished business on this chart. The two-year panel shows OBV grinding up from the deep 2025 trough all year and only recently reclaiming its average, while the chart itself annotates the current reading as price at highs with OBV lagging, a bearish non-confirmation. The mechanical reason is straightforward: OBV is cumulative, so four months of balanced up and down volume leave it far short of a price that has just repriced 16.9% in a day, and Friday's single large up-bar cannot close that distance on its own. This is where a sceptical reader earns their keep — the cleanest confirmation available over the next two weeks is simply the 90-day OBV line turning from flat to rising while staying above its MA20, which would say the accumulation is broadening rather than resting on one session.
Bull Case vs Bear Case
Bull Case
- The $57.00 close is the highest in a year and clears the entire $53.7–$54.8 ceiling that capped every 2026 rally, including the $54.42 high close of June 22.
- Fully aligned moving averages: close $57.00 > SMA5 $51.58 > SMA20 $50.70 > SMA60 $49.63, with price above the 90-day aVWAP $49.13 and the two-year aVWAP $45.82.
- Volume of 7,957,500 was 3.15× the 20-day average of 2,524,910, and the close landed near the session high of $57.65 rather than being faded.
- Mansfield RS versus the S&P 500 jumped to +10.3%, up 9.9 points on the week and 11.5 points on the month — positive and accelerating.
- MACD golden cross dated August 7 with both lines above zero (0.40 versus 0.06) and a histogram of +0.34.
- The move left an unfilled gap at $50.73–$53.63 beneath price, and OBV sits above its 20-day average on both timeframes (+48.7% and +9.61%).
Bear Case
- Every bullish reading on this page was produced by one session: a 16.9% advance from the August 6 close of $48.75, with nothing yet confirming it.
- A bearish RSI divergence is flagged on both frames — June 29 at price $53.73 with RSI 65.78 versus August 7 at price $57.00 with RSI 63.80.
- The close sits 4.0% above the upper Bollinger Band at $54.80, a stretched position that is normally relieved by consolidation or a move back inside the band.
- OBV slope is flat on both timeframes at a 52-week high, which the chart marks as a bearish non-confirmation of the price advance.
- ADX at 15.7 (16.0 on the 90-day frame) is deep in ranging territory — there is no established trend behind the breakout, only four months of chop.
- Overhead the unfilled November 8, 2024 gap runs up to $58.27, and this chart has a history of violent single-session repricings in both directions; ATR at 4.59% of price puts the 2×ATR line 9.2% away.
Scenarios
| Scenario | Probability | Path | Trigger / Invalidation |
|---|---|---|---|
| Digestion above the gap | ~40% | The move holds but pauses: price eases back toward the $55.05 (23.6%) and $53.85 (38.2%) retracement lines, where the upper Bollinger Band at $54.80 and the old $54.79 ceiling now sit as a first shelf, then builds a base on quieter volume. | Trigger: closes below $55.05 on volume falling back toward the 20-day average. Constructive while the gap top at $53.63 holds; losing it opens the gap. |
| Continuation through the 52-week high | ~40% | Follow-through arrives within days: price clears the $57.65 intraday high and works into the last unfilled overhead zone, the November 2024 gap capped at $58.27, with OBV turning from flat to rising. | Trigger: a daily close above $57.65 on volume at or above the 20-day average. Invalidated by a close back under $53.63. |
| Gap fill and failed breakout | ~20% | The session proves to be a one-day repricing that sellers work off: price loses $53.63, fills the $50.73–$53.63 gap and returns into the pre-breakout range, where the 2×ATR line at $51.77 sits inside the gap. | Trigger: a daily close below $50.73 — a complete gap fill — on expanding volume. A close under the $51.77 2×ATR line voids the setup outright. |
Key Levels
| Price | Role | Basis |
|---|---|---|
| $58.27 | Resistance | Top of the unfilled November 8, 2024 gap ($52.30–$58.27) — the last overhead structure on the two-year chart |
| $57.65 | Resistance | 52-week high, printed intraday on August 7 |
| $57.00 | Current price | August 7, 2026 close — Fibonacci 0% anchor of the current up swing |
| $55.05 | Support | Fibonacci 23.6% of the August 6–7 up swing — first shelf below the close |
| $54.80 | Support | Upper Bollinger Band; the old 2026 ceiling at $54.79 (June 22 intraday high) sits on the same line, and the 1×ATR stop is $54.39 |
| $53.63 | Support | Top of the August 7 gap ($50.73–$53.63) and the session low; Fibonacci 38.2% at $53.85 just above |
| $51.77 | Stop-loss | 2×ATR stop — objective invalidation (−9.2% from the close); Fibonacci 61.8% at $51.90 immediately above |
What to Watch
- Whether the $50.73–$53.63 gap stays open: a breakaway gap that is never traded back into is the single clearest evidence that Friday was a repricing rather than a spike.
- Volume character in the follow-up sessions: a pullback on volume shrinking back toward 2.5 million shares reads as digestion; expanding volume on lower closes reads as the move being given back.
- A daily close above $57.65: the intraday tag does not count — only a close above the 52-week high opens the last overhead zone up to $58.27.
- OBV slope on the 90-day frame: currently flat at +9.61% above its MA20; a turn to rising would answer the bearish non-confirmation, while a drop below the average would confirm it.
- Mansfield RS holding above zero: the jump to +10.3% came from one session, so the meaningful test is whether the line stays in positive territory over the next two weeks.
Conclusion
Past Analyses of This Stock same ticker · newest first
Other signals from this issue same publication date · 5 stocks
This analysis is an educational interpretation of chart data and is not investment advice. Probabilities and levels are subjective estimates; every investment decision, and its outcome, is your own responsibility. Technical signals describe what the chart has done, not what the company will do — always weigh fundamentals and your own risk tolerance before acting.
Two Week Swing · twoweekswing.com · 4,600+ stocks screened weekly