Atlanticus Holdings Corporation
$100.01 −12.5% from the 52-week high · +110.5% from the 52-week low
This analysis is based on closing-price data as of August 7, 2026. Whether you're researching how to buy Atlanticus Holdings Corporation stock or you've just opened a brokerage account and are trying to time an entry, here are objective support levels and stop-loss references built from the RSI, MACD and ATR indicators.
The two-year chart shows a stock that spent most of 2024 and 2025 range-bound between roughly $45 and $75 before breaking out in the spring of 2026 and more than doubling off the $47.50 52-week low. That advance carried Mansfield RS to +29.34% against the Nasdaq Composite and price to a $114.34 52-week high. The last session on the chart is the problem: after a pivot high at $111.79 on August 6, ATLC closed at $100.01 — a drop of roughly 10.5% that broke both the 5-day line at $108.30 and the 20-day line at $102.43 on 2.03× average volume, and completed a bearish RSI divergence that had been building since June. The working lens is a sharp retracement inside a still-rising longer-term structure, with the rising SMA60 at $94.87 as the line that matters and the 2×ATR reference at $88.03 as the objective invalidation.
Snapshot all values as of the August 7, 2026 close
| Close | $100.01 · −12.5% from 52w high, +110.5% from 52w low |
|---|---|
| 52-week high / low | $114.34 / $47.50 |
| SMA 5 / 20 / 60 | $108.30 / $102.43 / $94.87 — close below SMA5 and SMA20, above SMA60 |
| Bollinger (20) | Upper $113.02 · Mid $102.43 · Lower $91.84 · width 20.68% |
| aVWAP — 2y | $70.95 (anchored Mar 3, 2025) — price far above |
| aVWAP — 90d | $96.53 (anchored May 8, 2026) — price 3.6% above |
| RSI (14) | 47.12 (90d) / 47.12 (2y) — bearish divergence flagged |
| Mansfield RS vs the Nasdaq Composite | +29.34% — outperform, slope falling (prev week +45.26, prev month +36.02) |
| MACD (12,26,9) | MACD 3.01 · Signal 2.89 · Histogram +0.12 — golden cross on Jul 28, 2026 |
| ADX (14) | 22.32 (90d) / 21.93 (2y) — emerging trend |
| ATR (14) | $5.99 — 5.99% of price |
| OBV | 2y: early accumulation (above MA20, flat, +4.84%) · 90d: accumulation (above MA20, rising, +7.43%) |
| Volume | 356,900 vs 20-day average 175,430 — 2.03× average |
| Stop references | 1×ATR $94.02 · 2×ATR $88.03 |
① Price & Moving Averages
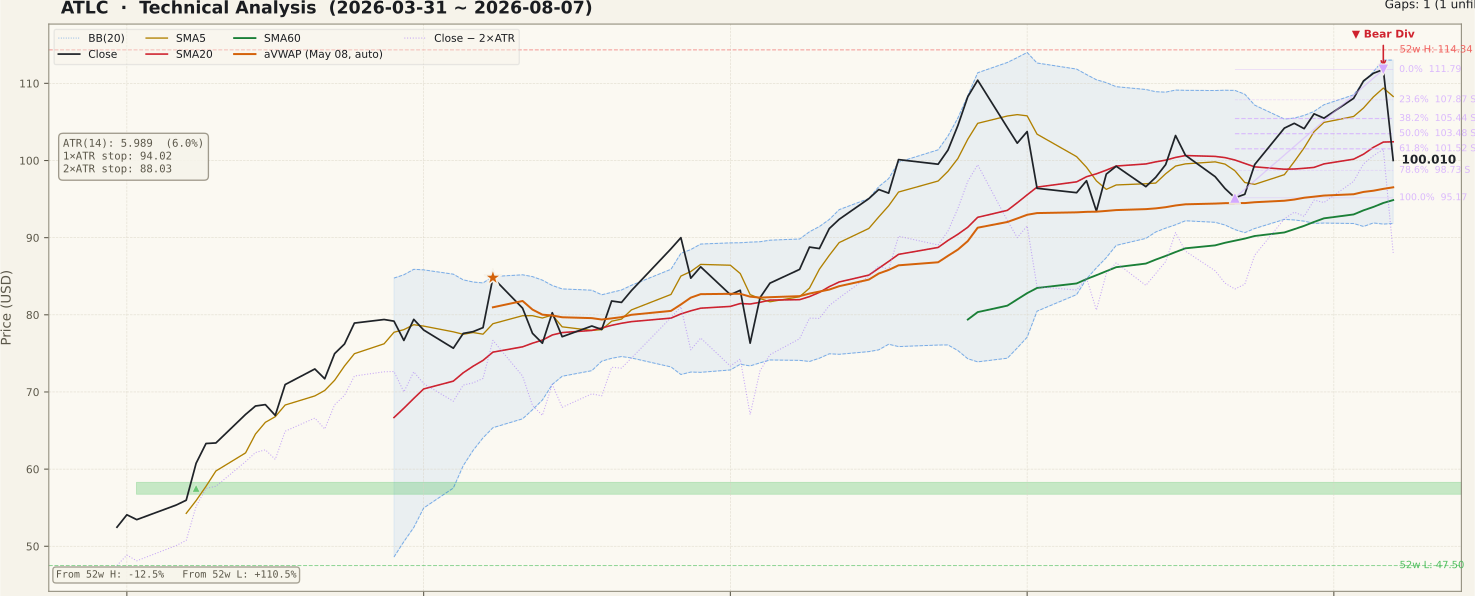
The moving-average stack is still in bullish order — SMA5 $108.30 above SMA20 $102.43 above SMA60 $94.87 — but price no longer is. The $100.01 close sits below the first two lines and above only the 60-day, which is the single most important structural fact on the page: the trend framework survives, the short-term one does not. The 20-day line doubles as the Bollinger midline at $102.43, so reclaiming it would repair both at once. Below price, the 78.6% retracement of the current 90-day up-swing sits at $98.73 and the swing origin — the July 22 low — at $95.17, almost on top of the SMA60 and the 1×ATR reference at $94.02; that three-way convergence is where this pullback either stops or stops being a pullback. Stretching to the two-year swing (the $76.33 June 3 low up to the $110.41 June 26 high), the 38.2% level lands at $97.39 and the 50% level at $93.37, reinforcing the same band. Both anchored VWAPs remain below price — $70.95 from the March 3, 2025 anchor and $96.53 from the May 8, 2026 anchor — so the average buyer from either anchor is still in profit, though the 90-day anchor is now only 3.6% away. The lone unfilled gap in the record, $56.74–$58.29 from April 8, 2026, is far enough below to be context rather than a level.
② Volume

The final session traded 356,900 shares against a 20-day average of 175,430 — 2.03× normal, and the largest bar of the last two weeks. Volume expansion on a decline of this size is the classic distribution signature; it is one bar and not proof of anything, but it is the opposite of what a benign, low-volume rest looks like. Worth noting from the 90-day panel: the other 2×-plus spikes of the quarter clustered in late June and early July, on the push to the highs, so the character of participation has changed direction. A liquidity caveat applies as well — a 20-day average near 175,000 shares works out to roughly $17 million a day in turnover, which is adequate but modest, so single-session volume readings here carry more noise and wider spreads than they would in a large-cap name. The generator's gap scan registers no new gap on this decline, so by that measure price travelled the distance through continuous trade rather than opening below the prior session.
③ MACD

MACD is technically still bullish and practically on the edge. The last cross was a golden cross on July 28, 2026, with MACD at 3.01 above its signal at 2.89 and the histogram at +0.12 — but that histogram is thin enough that a single further down session would flip it. Both lines sit far above zero, which is what a genuine uptrend looks like; it also means a cross down from here would be a momentum event inside a trend rather than a trend reversal in itself. The instructive detail on the 90-day panel is that MACD had already made a lower high in early August than its early-July peak while price was making a higher high — the same non-confirmation the RSI panel flags. Watch the histogram: a shallow dip that curls back up keeps the retracement reading alive, while an expanding negative that drags MACD toward zero would confirm that the energy behind the spring advance has drained.
④ RSI

RSI(14) reads 47.12 on both frames — neutral, and just under the 50 line that usually separates an uptrend's pullbacks from something more. The generator flags a regular bearish divergence and names both peaks: June 26, 2026 paired a price of $110.41 with RSI 79.39, while August 6, 2026 made a higher price of $111.79 on a materially lower RSI of 68.45 (the two-year frame reads 79.15 and 68.42 for the same peaks). Higher price on eleven fewer points of momentum is a textbook shape, and unlike most divergences this one resolved immediately rather than lingering. Two disciplines still apply. First, a divergence describes the rate of momentum, not a confirmed top — strong trends print them and continue after a rest. Second, the warning is now partly spent: RSI has already given back more than twenty points and is nowhere near oversold, so there is no momentum extreme to lean on in either direction. The level that decides the near-term character is 50 — recovering above it quickly would argue the excess was simply worked off; drifting further below it would mark a change in regime.
⑤ Mansfield RS vs the Nasdaq Composite

Mansfield RS stands at +29.34% against the Nasdaq Composite, still firmly in outperform territory — the two-year panel shows this line spent all of late 2024 through early 2026 oscillating around and below zero, so leadership is a 2026 development, not a permanent trait. The direction is the story. Against last week's +45.26, RS has surrendered −15.92 points; against last month's +36.02, −6.68 points. Both changes are negative inside positive territory, which is the positive-but-slowing quadrant — and the weekly give-back is severe enough to appear as a near-vertical drop at the right edge of the panel. That combination deserves precision rather than alarm: a stock beating its index by nearly thirty points is not a laggard, but losing sixteen points of relative performance in one week is exactly how leadership begins to unwind. RS sliding toward zero is usually the earliest warning available, arriving before price structure breaks; RS stabilizing in the twenties while price bases would be the constructive resolution.
⑥ ATR & ADX

ADX(14) at 22.32 on the 90-day frame (21.93 on two years) is tagged an emerging trend — above the 20 line but below the 25 threshold that marks genuine trend strength, and the panel shows it drifting down through July even as price pushed to new highs. That is a useful corrective to the eye: the advance looked powerful on the price panel, but by this measure it never developed the directional conviction that helps a trend absorb a shock. ADX measures strength, not direction, so a reading in the low twenties simply says there is less inertia here than the chart's slope suggests. ATR(14) is $5.99, or 5.99% of price, and the panel shows it stepping up sharply on the final bar. For sizing, that ATR is the practical input: a 1×ATR stop sits at $94.02 and a 2×ATR stop at $88.03 — roughly 12.0% below the close. Anyone using a tighter reference than that in a stock that routinely moves 6% in a session should expect ordinary noise to remove them.
⑦ OBV

OBV is the one panel that has not deteriorated, and the two frames agree in tone while differing in degree. On the 90-day frame OBV is tagged accumulation — above its 20-day average by +7.43% with a rising slope. On the two-year frame it reads early accumulation: above MA20 by +4.84% but with a flat slope, reflecting how much of the cumulative volume history predates the 2026 advance. Read together, the message is that the volume-weighted buying built through the spring has not yet been given back, even after a 2.03× down session — a genuine mark in the bulls' favor. The caution is timing: OBV is a cumulative series and reacts to sustained selling over days, not to one bar. The next few sessions are the test — OBV holding above its MA20 while price works through the $98.73–$95.17 band would say the decline was a repricing rather than an exit, while a break of the OBV MA20 on both frames would turn this last piece of confirmation into a non-confirmation.
Bull Case vs Bear Case
Bull Case
- Moving-average order is still bullish and rising: SMA5 $108.30 > SMA20 $102.43 > SMA60 $94.87, with price still above the 60-day.
- Mansfield RS at +29.34% vs the Nasdaq Composite remains deep in outperform territory even after the drop.
- MACD's July 28 golden cross still holds — MACD 3.01 above signal 2.89, both far above zero.
- 90-day OBV is tagged accumulation, above its MA20 by +7.43% with a rising slope; the two-year frame is also above MA20.
- Price sits above both anchored VWAPs ($70.95 from Mar 3, 2025; $96.53 from May 8, 2026) — the buyer base is not underwater.
- RSI unwound from 79 to 47.12 in weeks without reaching oversold, so the overbought excess is already discharged.
Bear Case
- Regular bearish RSI divergence completed: price $110.41 → $111.79 while RSI fell 79.39 → 68.45 (Jun 26 → Aug 6), and it resolved immediately.
- One session took price below both SMA5 ($108.30) and the SMA20 / Bollinger midline ($102.43).
- That decline printed 2.03× average volume — the quarter's participation has switched from pushing highs to selling them.
- Mansfield RS gave back −15.92 points week-over-week from +45.26; leadership is unwinding faster than price.
- ADX at 22.32 never reached the 25 strong-trend threshold, so there is limited trend inertia to absorb a shock.
- ATR at 5.99% of price means a single ordinary session covers the entire $98.73–$95.17 support band.
Scenarios
| Scenario | Probability | Path | Trigger / Invalidation |
|---|---|---|---|
| Deeper unwind into the trend band | 45% | Price loses the 78.6% retracement at $98.73, works through the two-year 38.2% level at $97.39, and tests the convergence of the July 22 low at $95.17, the SMA60 at $94.87 and the 1×ATR reference at $94.02 — the last shelf before the two-year 50% level at $93.37. | Trigger: daily close below $98.73 with volume at or above average. Invalidation: a recovery back above the 20-day line at $102.43 within the same week. |
| Retracement stabilizes, structure repairs | 35% | Price bases between $98.73 and the 90-day aVWAP at $96.53, the MACD histogram holds above zero, OBV stays above its MA20, and a reclaim of $102.43 opens the SMA5 at $108.30 and the August 6 pivot at $111.79. | Trigger: daily close back above $102.43 with RSI recovering through 50. Invalidation: daily close below $95.17. |
| Divergence resolves as a top | 20% | The $95.17–$94.02 shelf fails, RS continues its slide toward zero, MACD crosses down and the spring advance unwinds toward the two-year 50% and 61.8% levels at $93.37 and $89.35 and through the 2×ATR reference at $88.03. | Trigger: sustained trade below the 2×ATR stop at $88.03. Invalidation: RSI reclaiming 50 while price defends $95.17. |
Key Levels
| Price | Role | Basis |
|---|---|---|
| $111.79 | Resistance | August 6 pivot high — Fibonacci 0% anchor of the current 90-day up-swing |
| $108.30 | Resistance | SMA5 — the line price lost in the last session |
| $102.43 | Resistance | SMA20 and Bollinger midline; the two-year 23.6% level at $102.37 sits in the same shelf |
| $100.01 | Current | Close of August 7, 2026 |
| $98.73 | Support | Fibonacci 78.6% retracement of the $95.17 → $111.79 swing — the first floor |
| $95.17 | Support | July 22 swing low (Fibonacci 100%), with the SMA60 at $94.87 and the 1×ATR reference at $94.02 immediately beneath |
| $88.03 | 2×ATR stop | Objective invalidation — 12.0% below the close, under the two-year 61.8% level at $89.35 |
What to Watch
- The $98.73–$95.17 band. This is where the 78.6% retracement, the July 22 swing low, the SMA60 at $94.87 and the 1×ATR reference at $94.02 converge. Holding it keeps the retracement reading; losing it on a closing basis shifts the burden of proof entirely.
- The catalyst behind the August 7 decline. A 10.5% single-session drop from the August 6 pivot, landing in the Q2 2026 earnings window, is not a chart event — verify what was reported before reading any technical level as meaningful.
- Volume character over the next three sessions. The decline came on 2.03× average volume. A repeat of that pattern on further weakness is a very different signal from a quiet drift lower.
- Mansfield RS direction. Still +29.34%, but −15.92 on the week. RS stabilizing in the twenties would be constructive; a continued slide toward zero is the earliest warning the chart offers.
- The MACD histogram and the OBV MA20. At +0.12 the histogram is one session from flipping, and OBV above its MA20 on both frames is the last unbroken confirmation. Losing both together would align every panel bearishly.
Conclusion
Past Analyses of This Stock same ticker · newest first
Other signals from this issue same publication date · 5 stocks
This analysis is an educational interpretation of chart data and is not investment advice. Probabilities and levels are subjective estimates; every investment decision, and its outcome, is your own responsibility. This stock declined sharply in the final session on the chart, in a period that coincides with its quarterly results — technical signals alone are not a basis for action here. Chart data reflects closing prices through August 7, 2026 and does not account for events after that date.
Two Week Swing · twoweekswing.com · 4,600+ stocks screened weekly